
Finding the right data visualization tool is essential for turning data into insights. While Redash is a popular choice, it might not meet everyone’s needs. In this blog, we’ll explore top Redash alternatives that offer powerful features, better usability, and more flexibility to fit your requirements.
- Draxlr: Draxlr is a powerful data visualization and analytics tool with AI functionalities designed to simplify businesses' data interactions. It allows users to connect databases, run queries, and create stunning dashboards without extensive coding knowledge.
- Looker: Looker is a modern business intelligence platform that offers customizable dashboards, real-time data exploration, and robust integration with tools like BigQuery and Salesforce for tailored actionable insights.
- Tableau: Tableau is a leading visual analytics platform that transforms data into actionable insights through interactive dashboards, AI-driven features, and seamless integration with various data sources.
- Power BI: Power BI is a dynamic analytics platform that integrates data visualization, AI-driven insights, and seamless collaboration to transform raw data into actionable intelligence.
- Datapad: Datapad is a lightweight, mobile-first business dashboard that offers real-time performance tracking, team collaboration, and customizable analytics to empower data-driven decisions on the go.
1. Draxlr
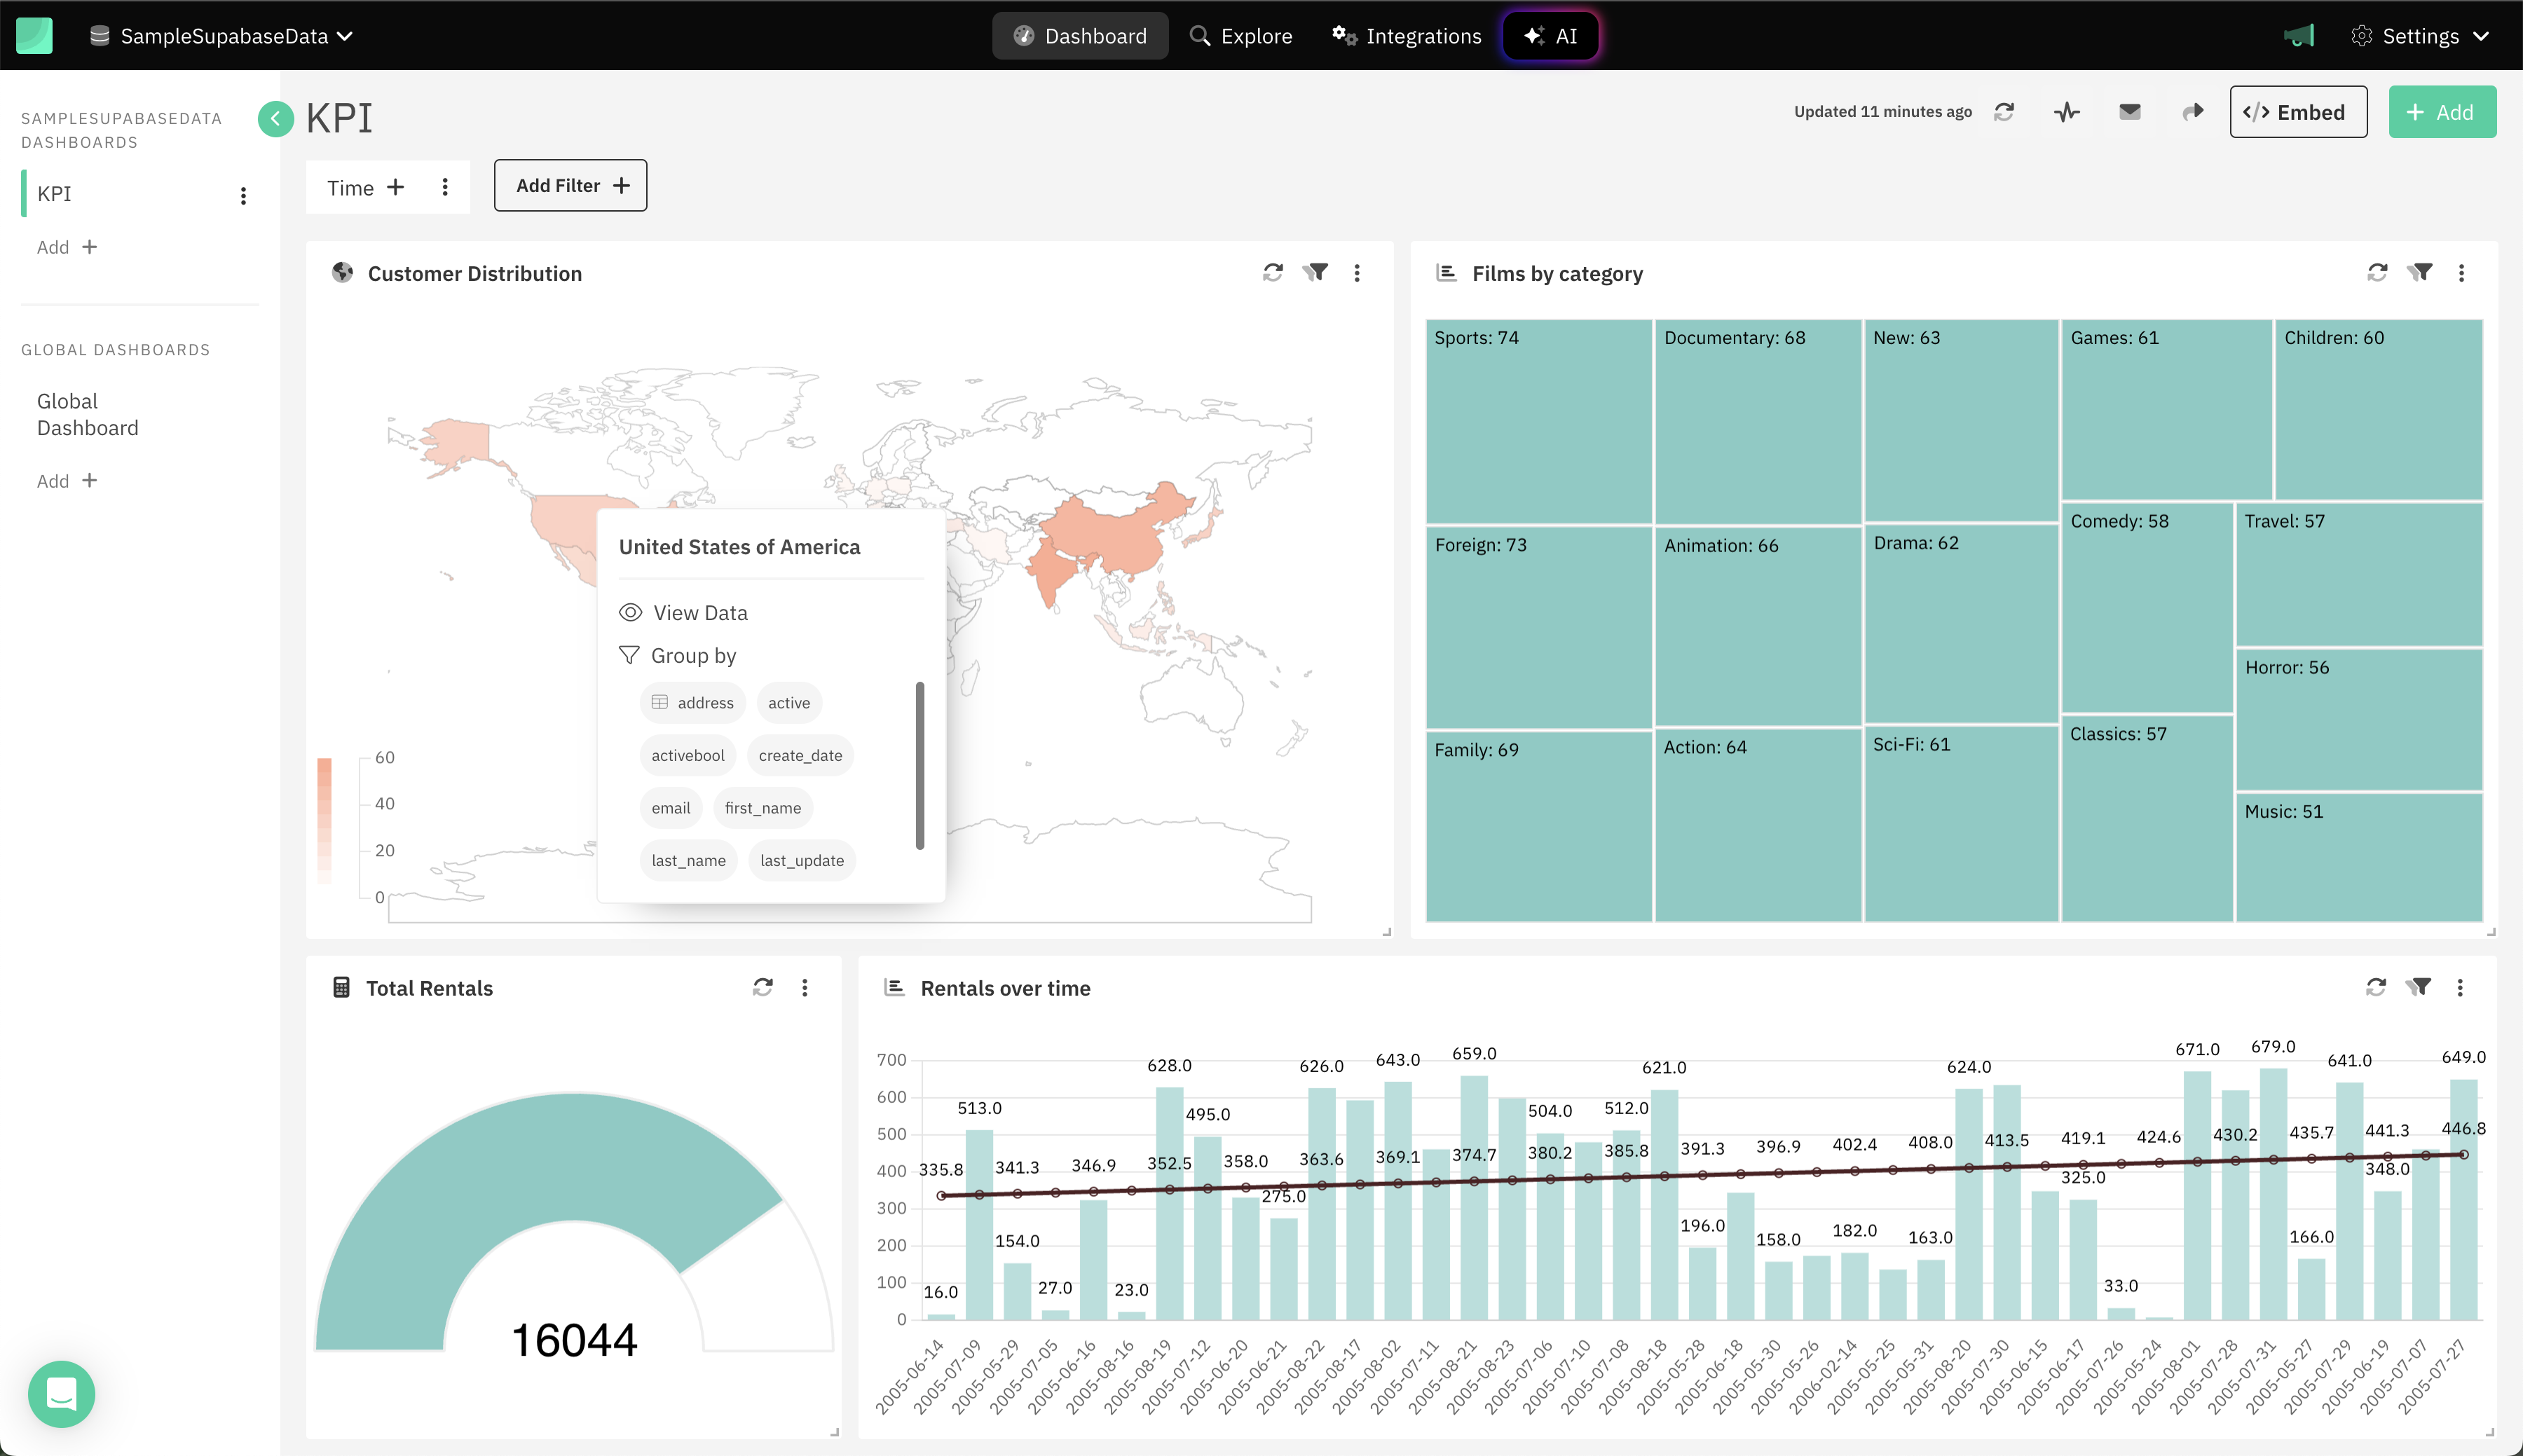
Draxlr is a data analytics platform that transforms raw data into actionable insights. It offers intuitive visualization tools and analytics to simplify data exploration and reporting.
Connect your Database
Key Features
- Connects with multiple databases to streamline data integration.
- Query builder to manage data by filtering, summarization, grouping, and joining without code.
- Generation of SQL queries via prompts using AI.
- Draxlr AI: Natural language input for creating dashboards with insights.
- Accurate correction of fed SQL queries using AI.
- Intuitive visualization of data using a large suite of graphs and charts.
- Drill-down feature to dive deeper into charts or graphs and zoom further into available data.
- Auto-generation of insights from tables without writing SQL.
- Creation of own dashboards with graphs and tables for data visualization.
- Embed dashboards to run them on websites.
- Slack alerts for a specific time, periodically, or only when data changes occur.
- Email notifications when there is a change in business data, ensuring you stay informed in real-time.
- Sharing dashboard items with the help of public URLs that can be securely accessed via a PIN.
- Live mode to review updated data in intervals of 10 minutes and broadcast dashboards to TV.
- Integrates with Slack, Google Sheets, email, and API.
- Gentle learning curve.
- Exceptional customer support.
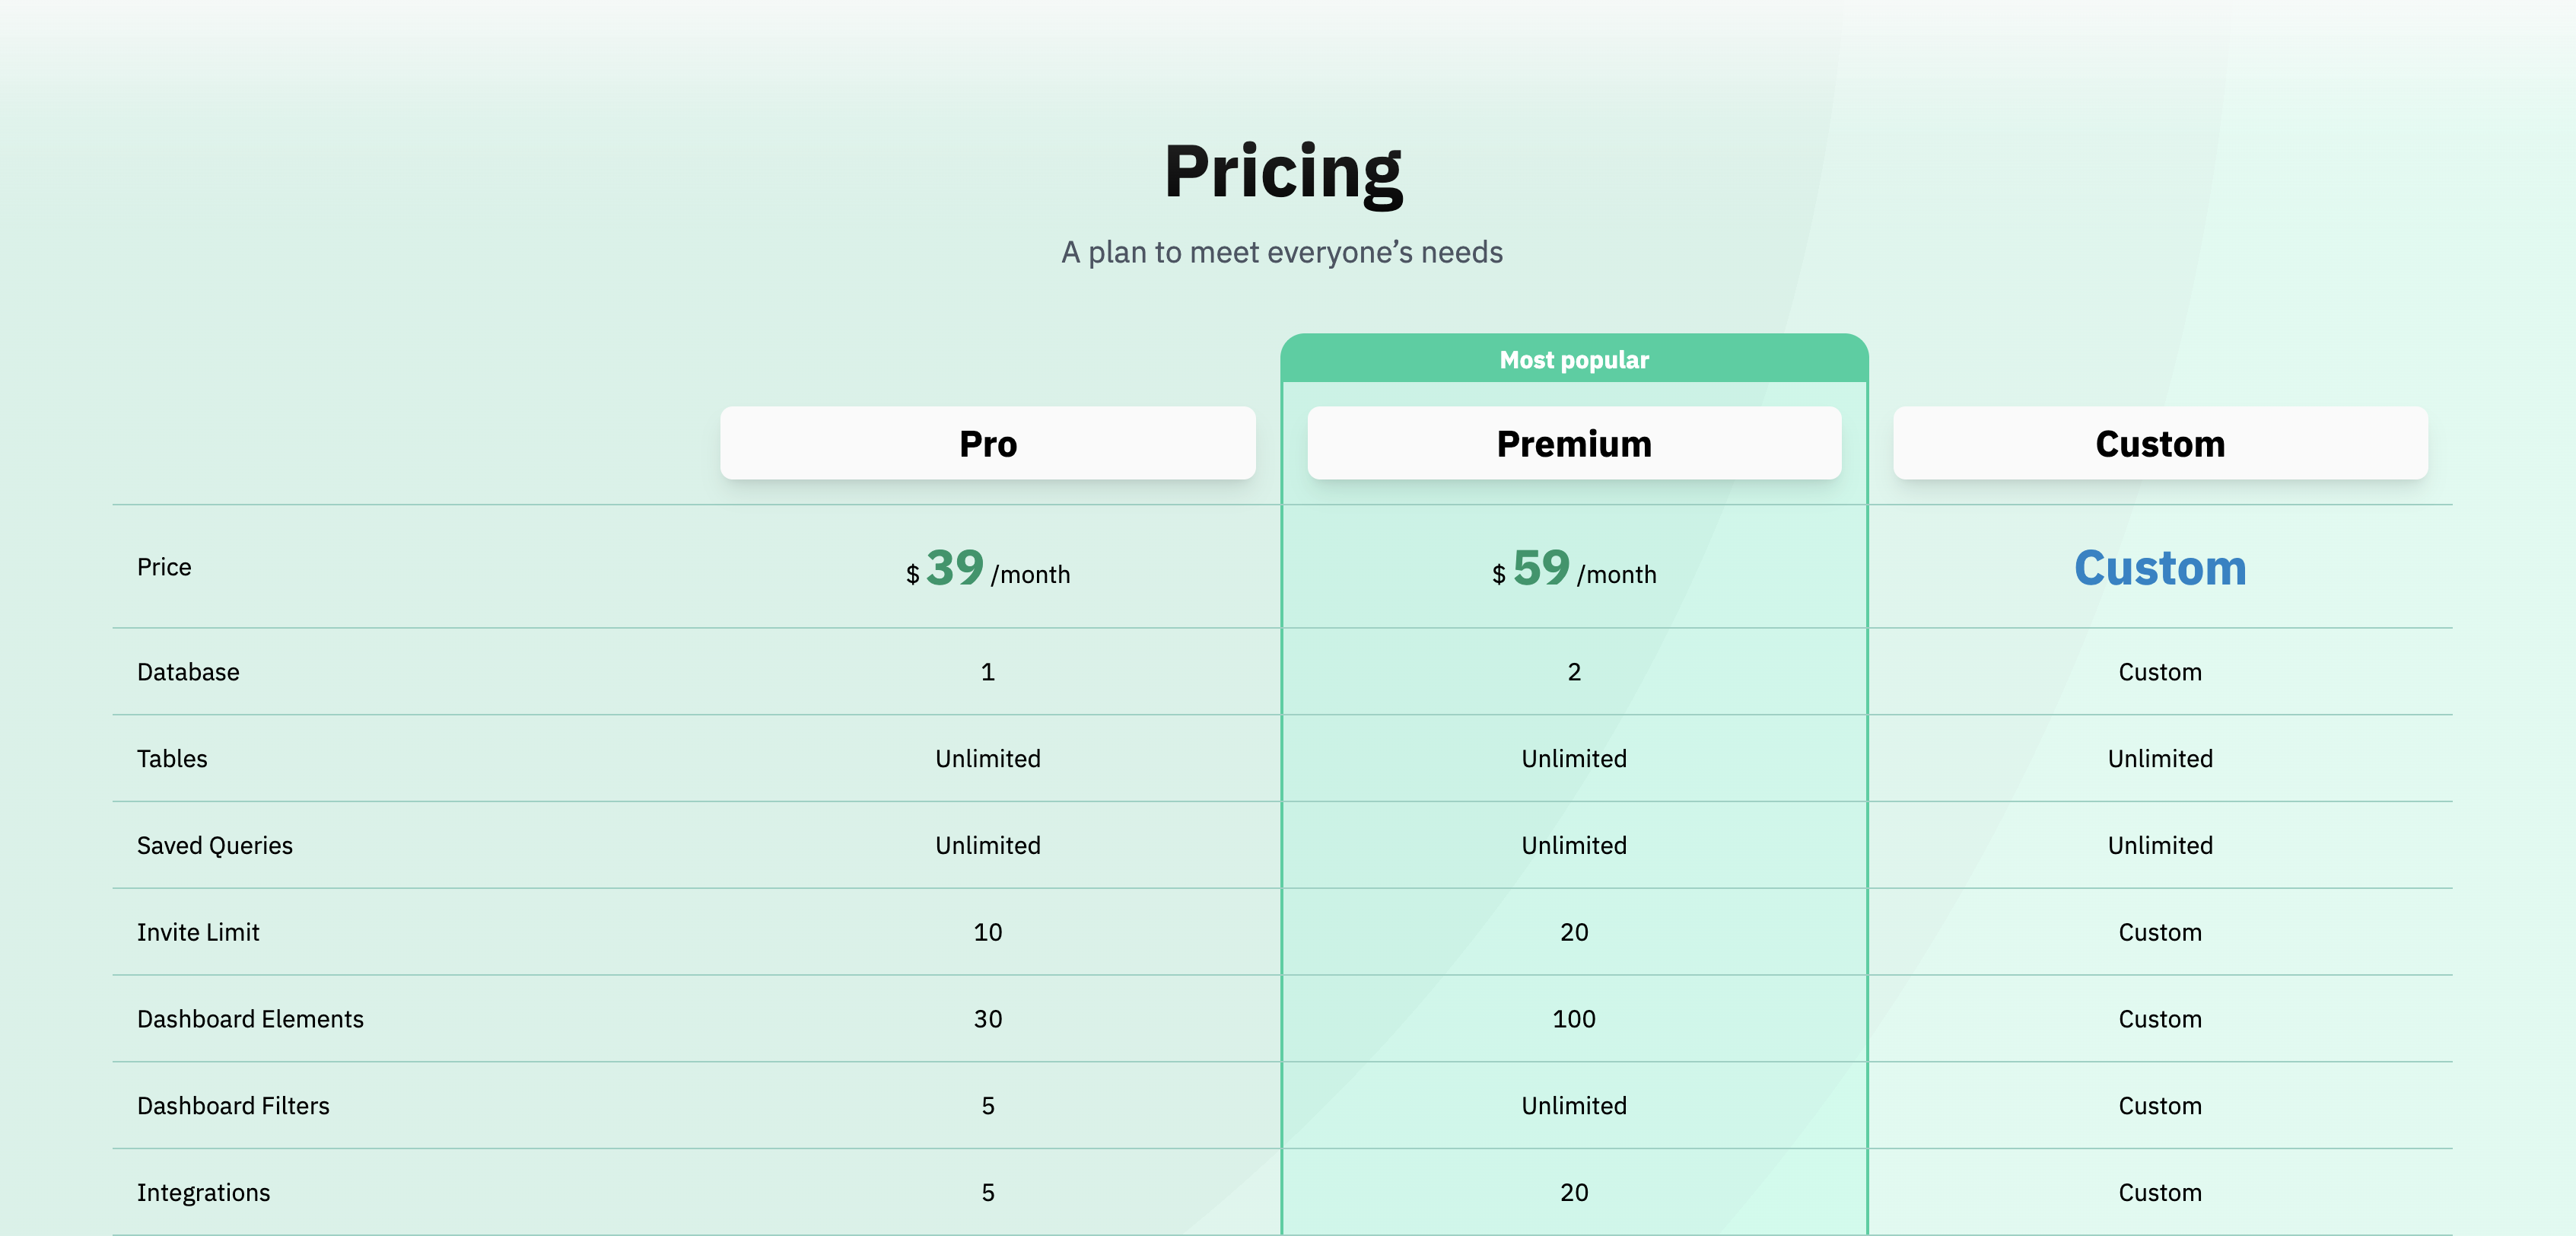
Pricing
2. Looker
Looker is a cloud-based platform that does not require downloading any software.

Key Features
- Connects to a wide range of data sources and performs analysis without the Extract-Transform-Load layer.
- Embedded analytics for dashboards in apps.
- API-first data tool that enables users to seamlessly integrate, manage, and analyze their data across various platforms.
- Ability to schedule and send dashboards by email, webhook, Amazon S3 Bucket, or SFTP server.
- Ready sample reports to build on.
- Interactive reports with viewer and date filters.
- Configuration of row-level and column-level security permissions.
- Git Integrated IDE with version control: Easy team collaboration for working together on developing a data app.
- Reports will be delivered only if specific conditions are met.
- Conditional formatting for color and font formatting needs.
Pricing
Tailored pricing solutions.
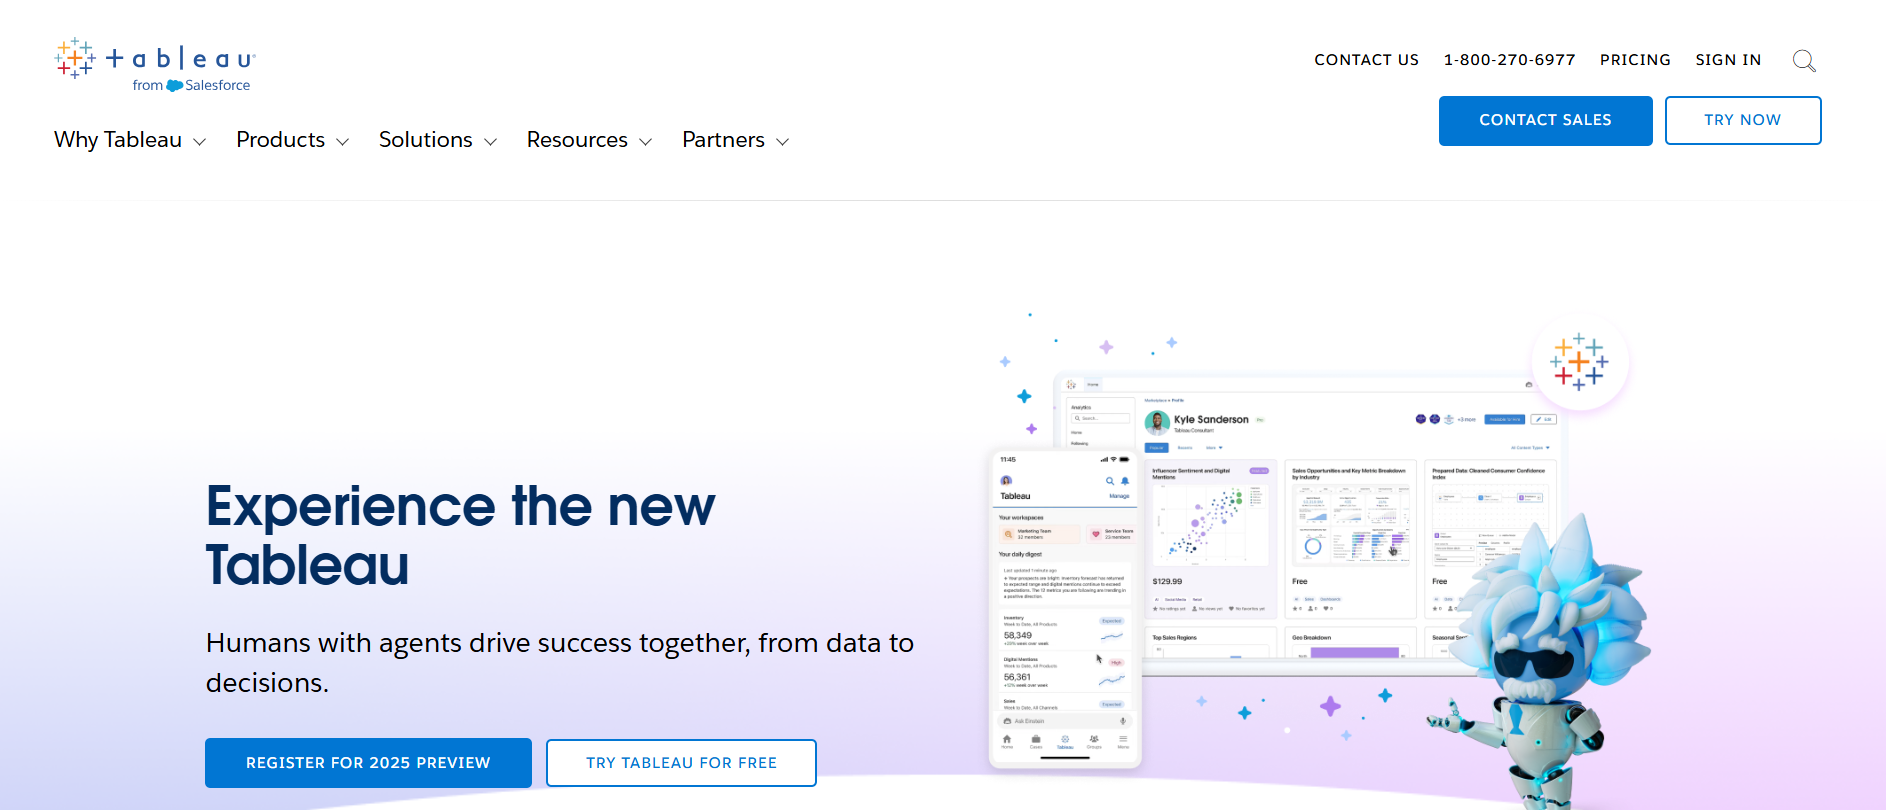
3. Tableau
Tableau is a popular data visualization tool with a friendly user interface.
Key Features
- Integrates with a large number of tools.
- Different levels of access are assigned to users based on their roles within the organization, ensuring sensitive data security.
- Data encryption for protection against unauthorized entry and possible security violations.
- The Tableau Cloud Manager enables the creation and management of multiple Tableau sites across preferred regions.
- Tableau Einstein: A powerful analytics platform built on Salesforce, designed to work seamlessly with Agentforce, a set of customizable AI tools.
- Table Vix Extension: Incorporates detailed tables and grid views into dashboards to accommodate users who favor traditional reporting formats.
- AI to help with data analysis through input of queries in the natural English language.
- Easy organization and cataloging of data sources to simplify searching and management.
- Unified tooltips to compare different visualizations easily.
- Subscriptions for scheduled updates of contents such as dashboards in email.
Pricing
The sales team needs to be contacted for pricing.
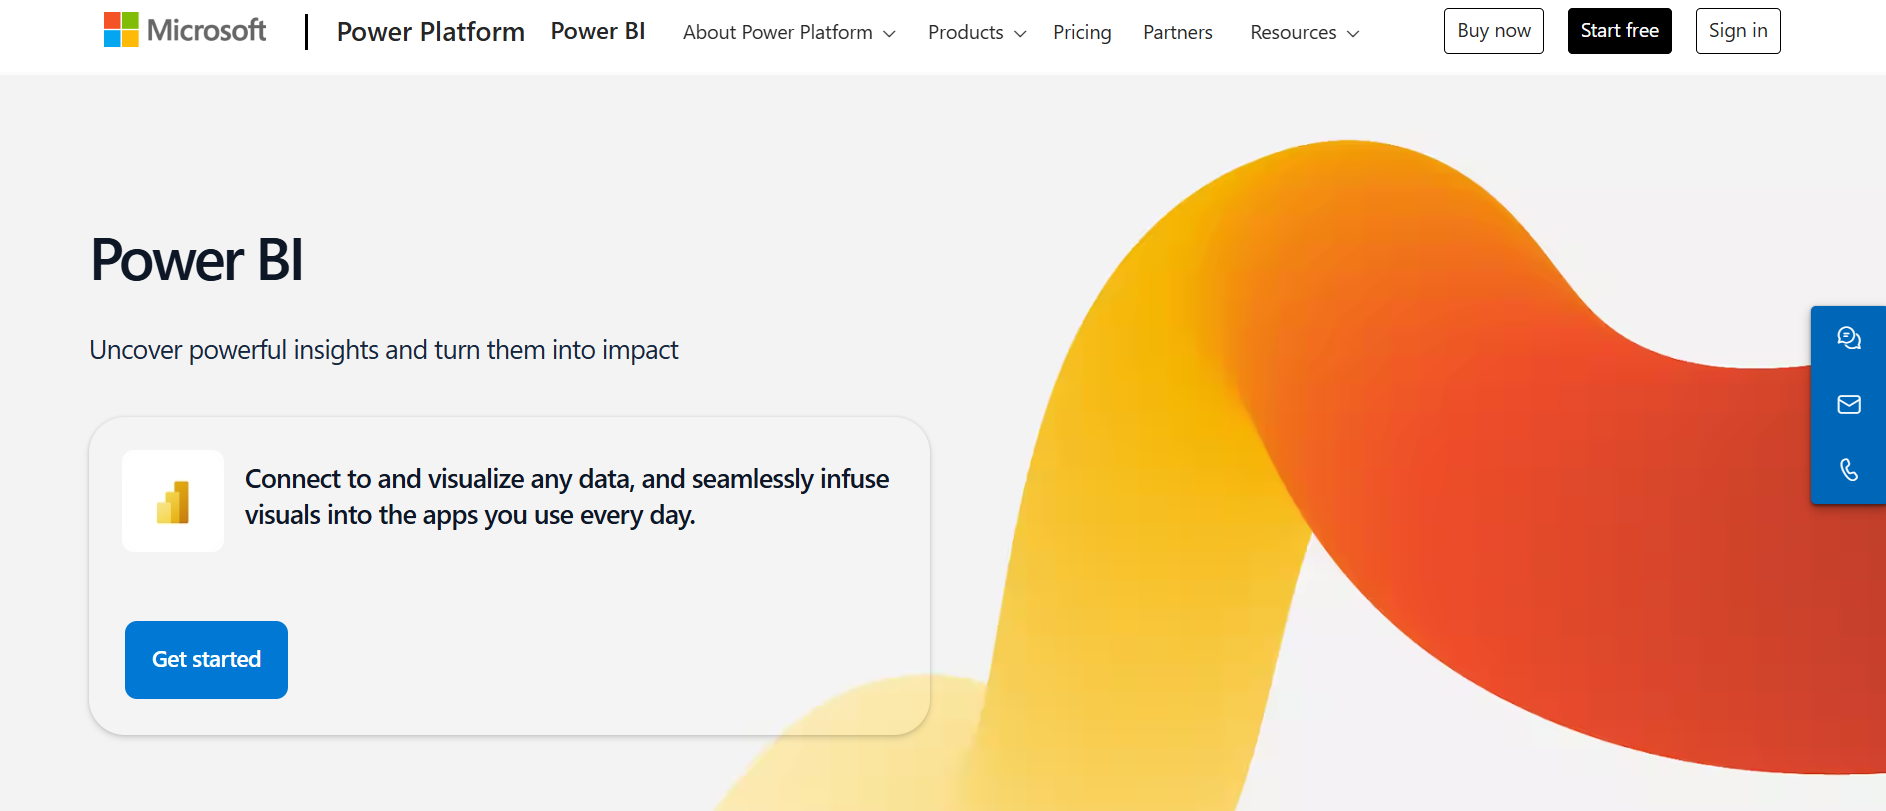
4. Power BI
Microsoft Power BI is a data visualization tool that supports a large number of data connectors.
Key Features
- Library of custom visualizations.
- DAX Data Analysis Function for pre-written codes used to perform specific data analysis tasks.
- Content packs to access a collection of elements, eliminating the need to search for them individually.
- Automated data refreshes for accurate insights.
- Power BI mobile app for viewing and sharing data on the go.
- The ability to create measures in a data model and reuse them across multiple connected reports.
- Creation of custom data visualizations with R and Python.
- Power Query for a low/no-code import and transformation of data from various sources.
- The Q&A feature lets users ask questions about data and get answers using natural language processing.
- APIs for integration.
Pricing
Starts at $10 per user per month.
5. Datapad
Datapad is best used for constant monitoring of business KPIs.
Key Features
- AI-powered data analysis.
- Supports a wide range of database integrations, allowing users to connect and query data from multiple sources.
- A suite of pre-built templates to build reports on.
- Instant notifications for metric changes.
- Daily email updates for subscribed dashboards.
- Notifications on the phone for timely updates.
- Collaboration on metrics right on the dashboard.
- Easy customization of dashboards.
- AI assistant that answers queries with charts and tables.
- Read-only links for sharing performance reports with clients.
Pricing
Starts at $21 per month with a limited number of dashboards.
Conclusion
There are various alternatives to Redash, each offering distinct features and functionalities. Choosing the right tool—Draxlr, Looker, Tableau, Power BI, or Datapad—depends on your team’s specific requirements and the desired approach to data visualization and analysis.
FAQs
1. What is the free alternative to Redash?
Draxlr with a 14-day free trial is the best alternative to Redash. With a gentle learning curve and top-notch customer support, Draxlr is the right choice if you are looking for a data visualization tool that combines ease of use, powerful features, and reliable performance to make data analysis seamless and efficient.
2. What is the alternative to Redash self-hosting?
Draxlr is the ideal alternative to Redash if you are looking for a data visualization tool that allows you to self-host. You can contact the friendly customer support team at Draxlr to create a custom plan for you that enables you to self-host.
3. Does Redash use SQL?
Yes, Redash, like other great data visualization tools such as Draxlr, uses SQL as its foundation to create powerful and stunning data visualizations. By leveraging SQL, these tools enable users to efficiently query data, transform it into meaningful insights, and present it through visually compelling charts and dashboards that enhance business decision-making.

