A well-designed dashboard is essential for any business as it provides a centralized view of critical metrics and performance indicators, enabling informed decision-making. SQL dashboards, in particular, offer significant advantages by allowing real-time data access, customization, and detailed analytics.
But with the integration of AI, they’re becoming even more powerful. AI-powered SQL dashboards can automate data analysis, enhance visualization, and provide deeper insights faster than ever before. Whether you’re a data analyst, a business person, or someone with limited technical skills, this guide will walk you through the process of building AI-powered SQL dashboards using Draxlr.
Key benefits of SQL Dashboards
1. Real-Time Monitoring and Analytics
- Instant Updates: Provides real-time data updates for quick decision-making.
- Real-Time Alerts: Sends alerts based on specific conditions, allowing prompt action.
2. Customization and Flexibility
- Tailored Dashboards: Customizable for different users or departments.
- Interactive Features: Allows users to drill down, apply filters, and perform ad-hoc queries.
3. Enhanced Decision-Making
- Data-Driven Strategies: Visualizes data for informed decision-making.
- Predictive Analytics: Includes advanced analytics for forecasting and risk identification.
4. Performance Tracking and Reporting
- Goal Alignment: Tracks progress towards business goals and KPIs.
- Automated Reporting: Automates report generation and distribution.
5. Efficient Collaboration and Communication
- Shared Insights: Promotes transparency and teamwork with a shared view of metrics.
- Visual Communication: Uses charts and graphs for clear and effective communication.
6. Cost and Time Efficiency
- Resource Optimization: Automates data management, saving time and resources.
- Reduced Costs: Improves operational efficiency, leading to cost savings.
How to use AI to build your SQL Dashboard with Draxlr
Draxlr is a self-serve business intelligence (BI) tool that uses AI to simplify data analysis and visualization. It allows users to generate SQL queries through natural language inputs, create customizable dashboards, and visualize data in real-time. Draxlr integrates with various data sources and facilitates team collaboration through easy sharing and access controls, empowering organizations to foster a data-driven culture.
Connect your DatabaseOption 1: Generate specific SQL queries with AI
You can provide Draxlr AI-specific instructions for an ad-hoc query, and it will generate the SQL query for that requirement.
Here are the steps:
-
Click on the AI option in the navbar.

-
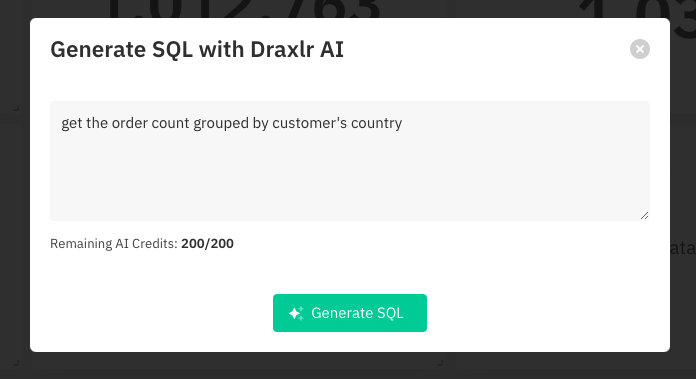
Provide your instructions in the Generate SQL with Draxlr AI popup.
-
Draxlr will generate the required SQL and show the result of the same in tabular format. You can choose to visualize it as a different type of graph, like a map.

To learn more about this feature, please read How to Generate SQL Queries with AI.
Option 2: Generate the entire dashboard with AI
Draxlr’s powerful AI-driven feature allows you to generate entire dashboards quickly and effortlessly, providing immediate insights into your SQL database. By simply providing a list of tables and a brief description of your dashboard requirements, Draxlr leverages its AI capabilities to create comprehensive dashboard items in a matter of seconds. This functionality is particularly beneficial for users who need rapid analytics without investing significant time or effort in manual setup.
The AI-driven dashboard generation process involves understanding the structure and relationships within your database tables, and then intelligently designing visualizations that best represent your data. Draxlr’s AI considers various factors, such as key performance indicators (KPIs), data trends, and relevant metrics, to ensure the generated dashboards are both insightful and actionable.
This feature is especially useful for:
-
Quick Prototyping: When you need to prototype dashboards for presentations or decision-making meetings, Draxlr’s AI can swiftly create visually appealing and informative dashboards, allowing you to focus on interpreting the insights rather than building the visuals.
-
Exploratory Data Analysis: For initial exploratory analysis, Draxlr provides a fast way to get a broad overview of your data. This can help identify patterns, anomalies, and areas of interest that may warrant deeper investigation.
-
Time-Saving for Non-Technical Users: Users who may not have extensive technical skills or SQL knowledge can still benefit from sophisticated data analytics. Draxlr democratizes data access, enabling anyone in the organization to generate meaningful dashboards without relying on specialized data teams.
A quick demo video:
Here are the steps:
-
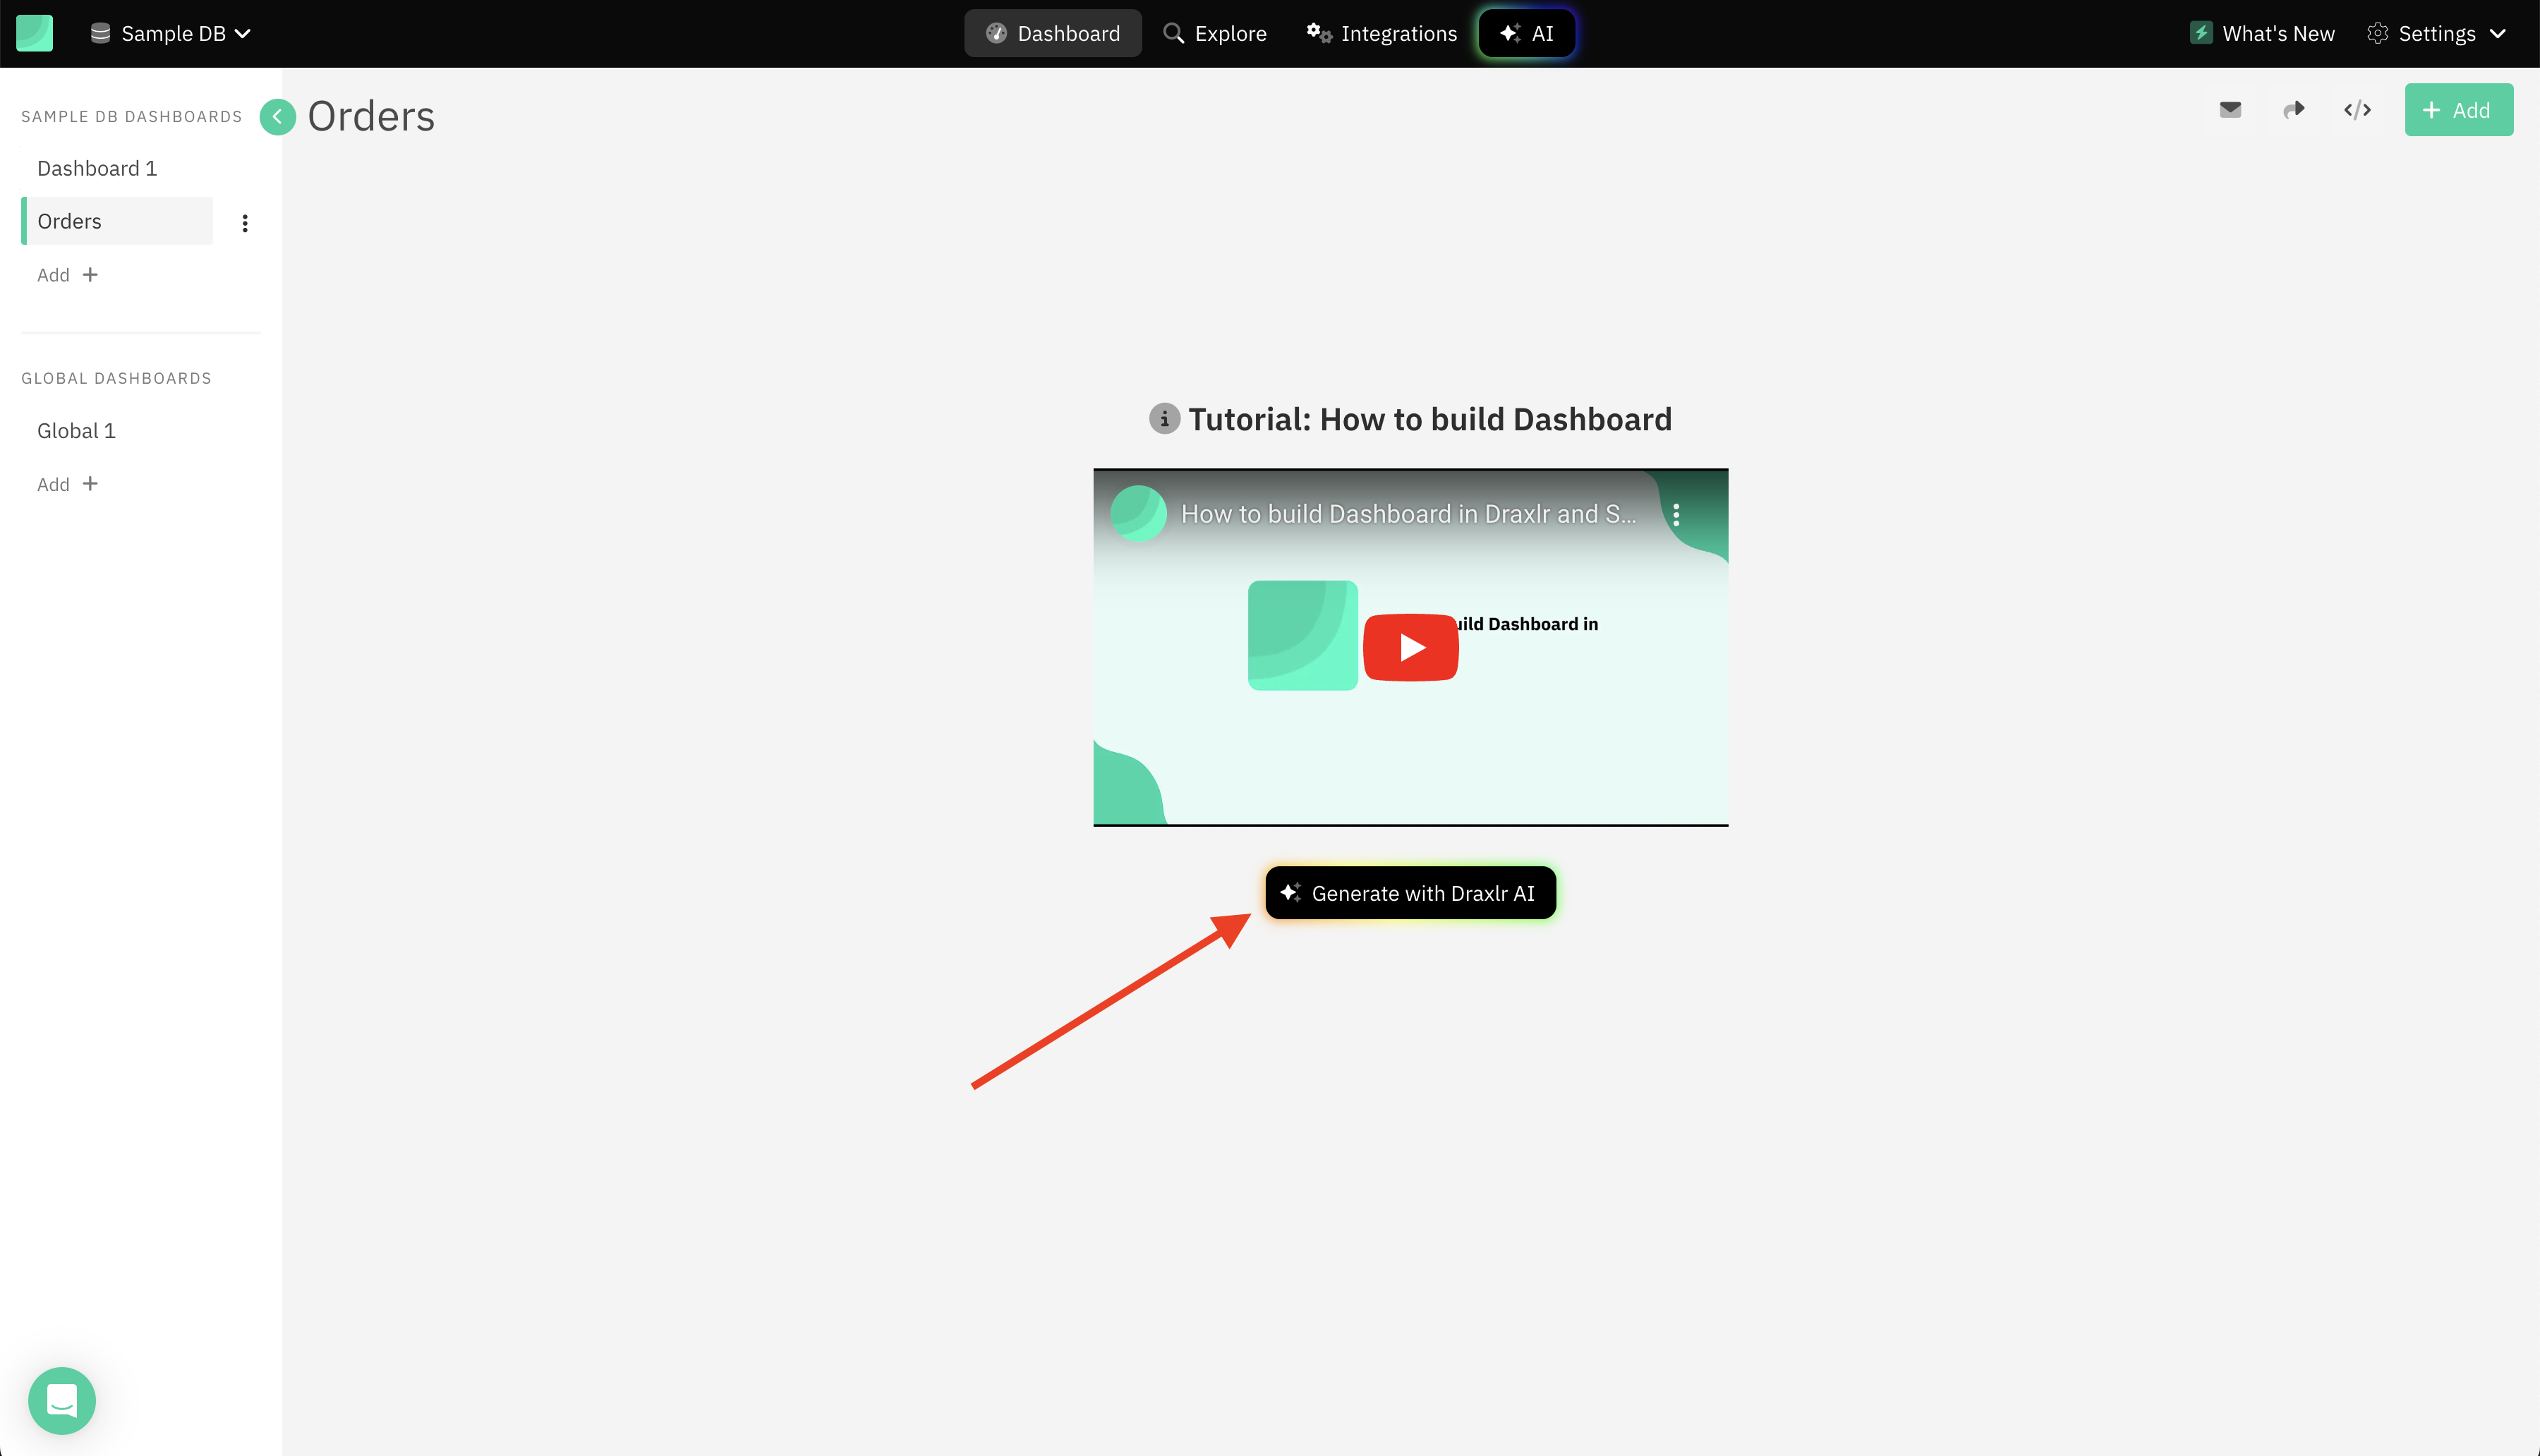
Visit the dashboard page where you want to add dashboard items via AI. Click on Generate with Draxlr AI.
-
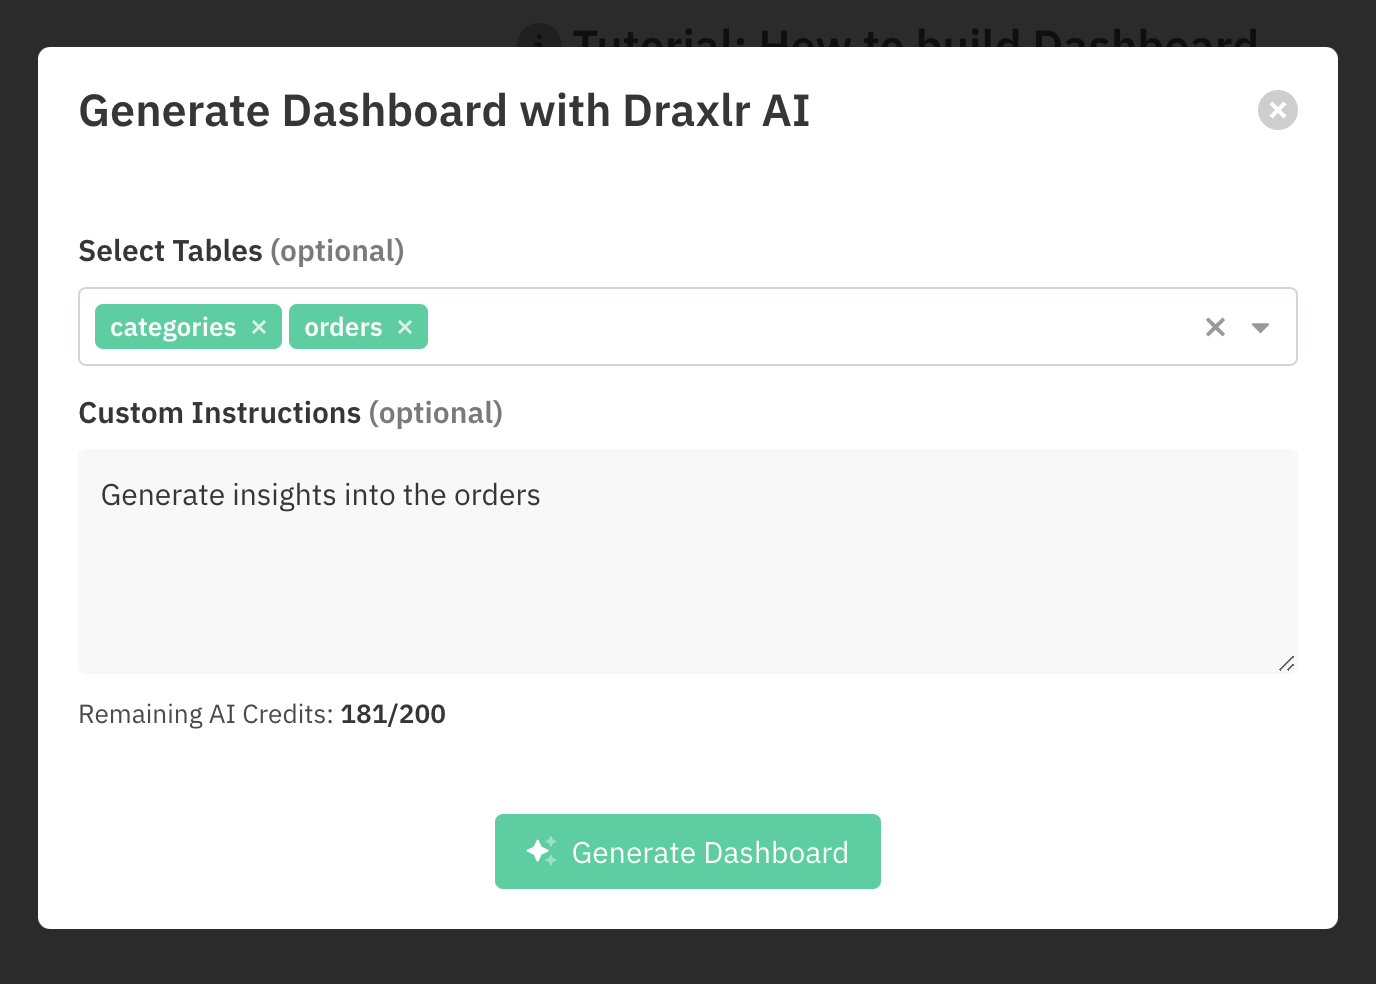
On the popup, you can provide the tables for which you want the insights. You can also give a brief description of the dashboard.
-
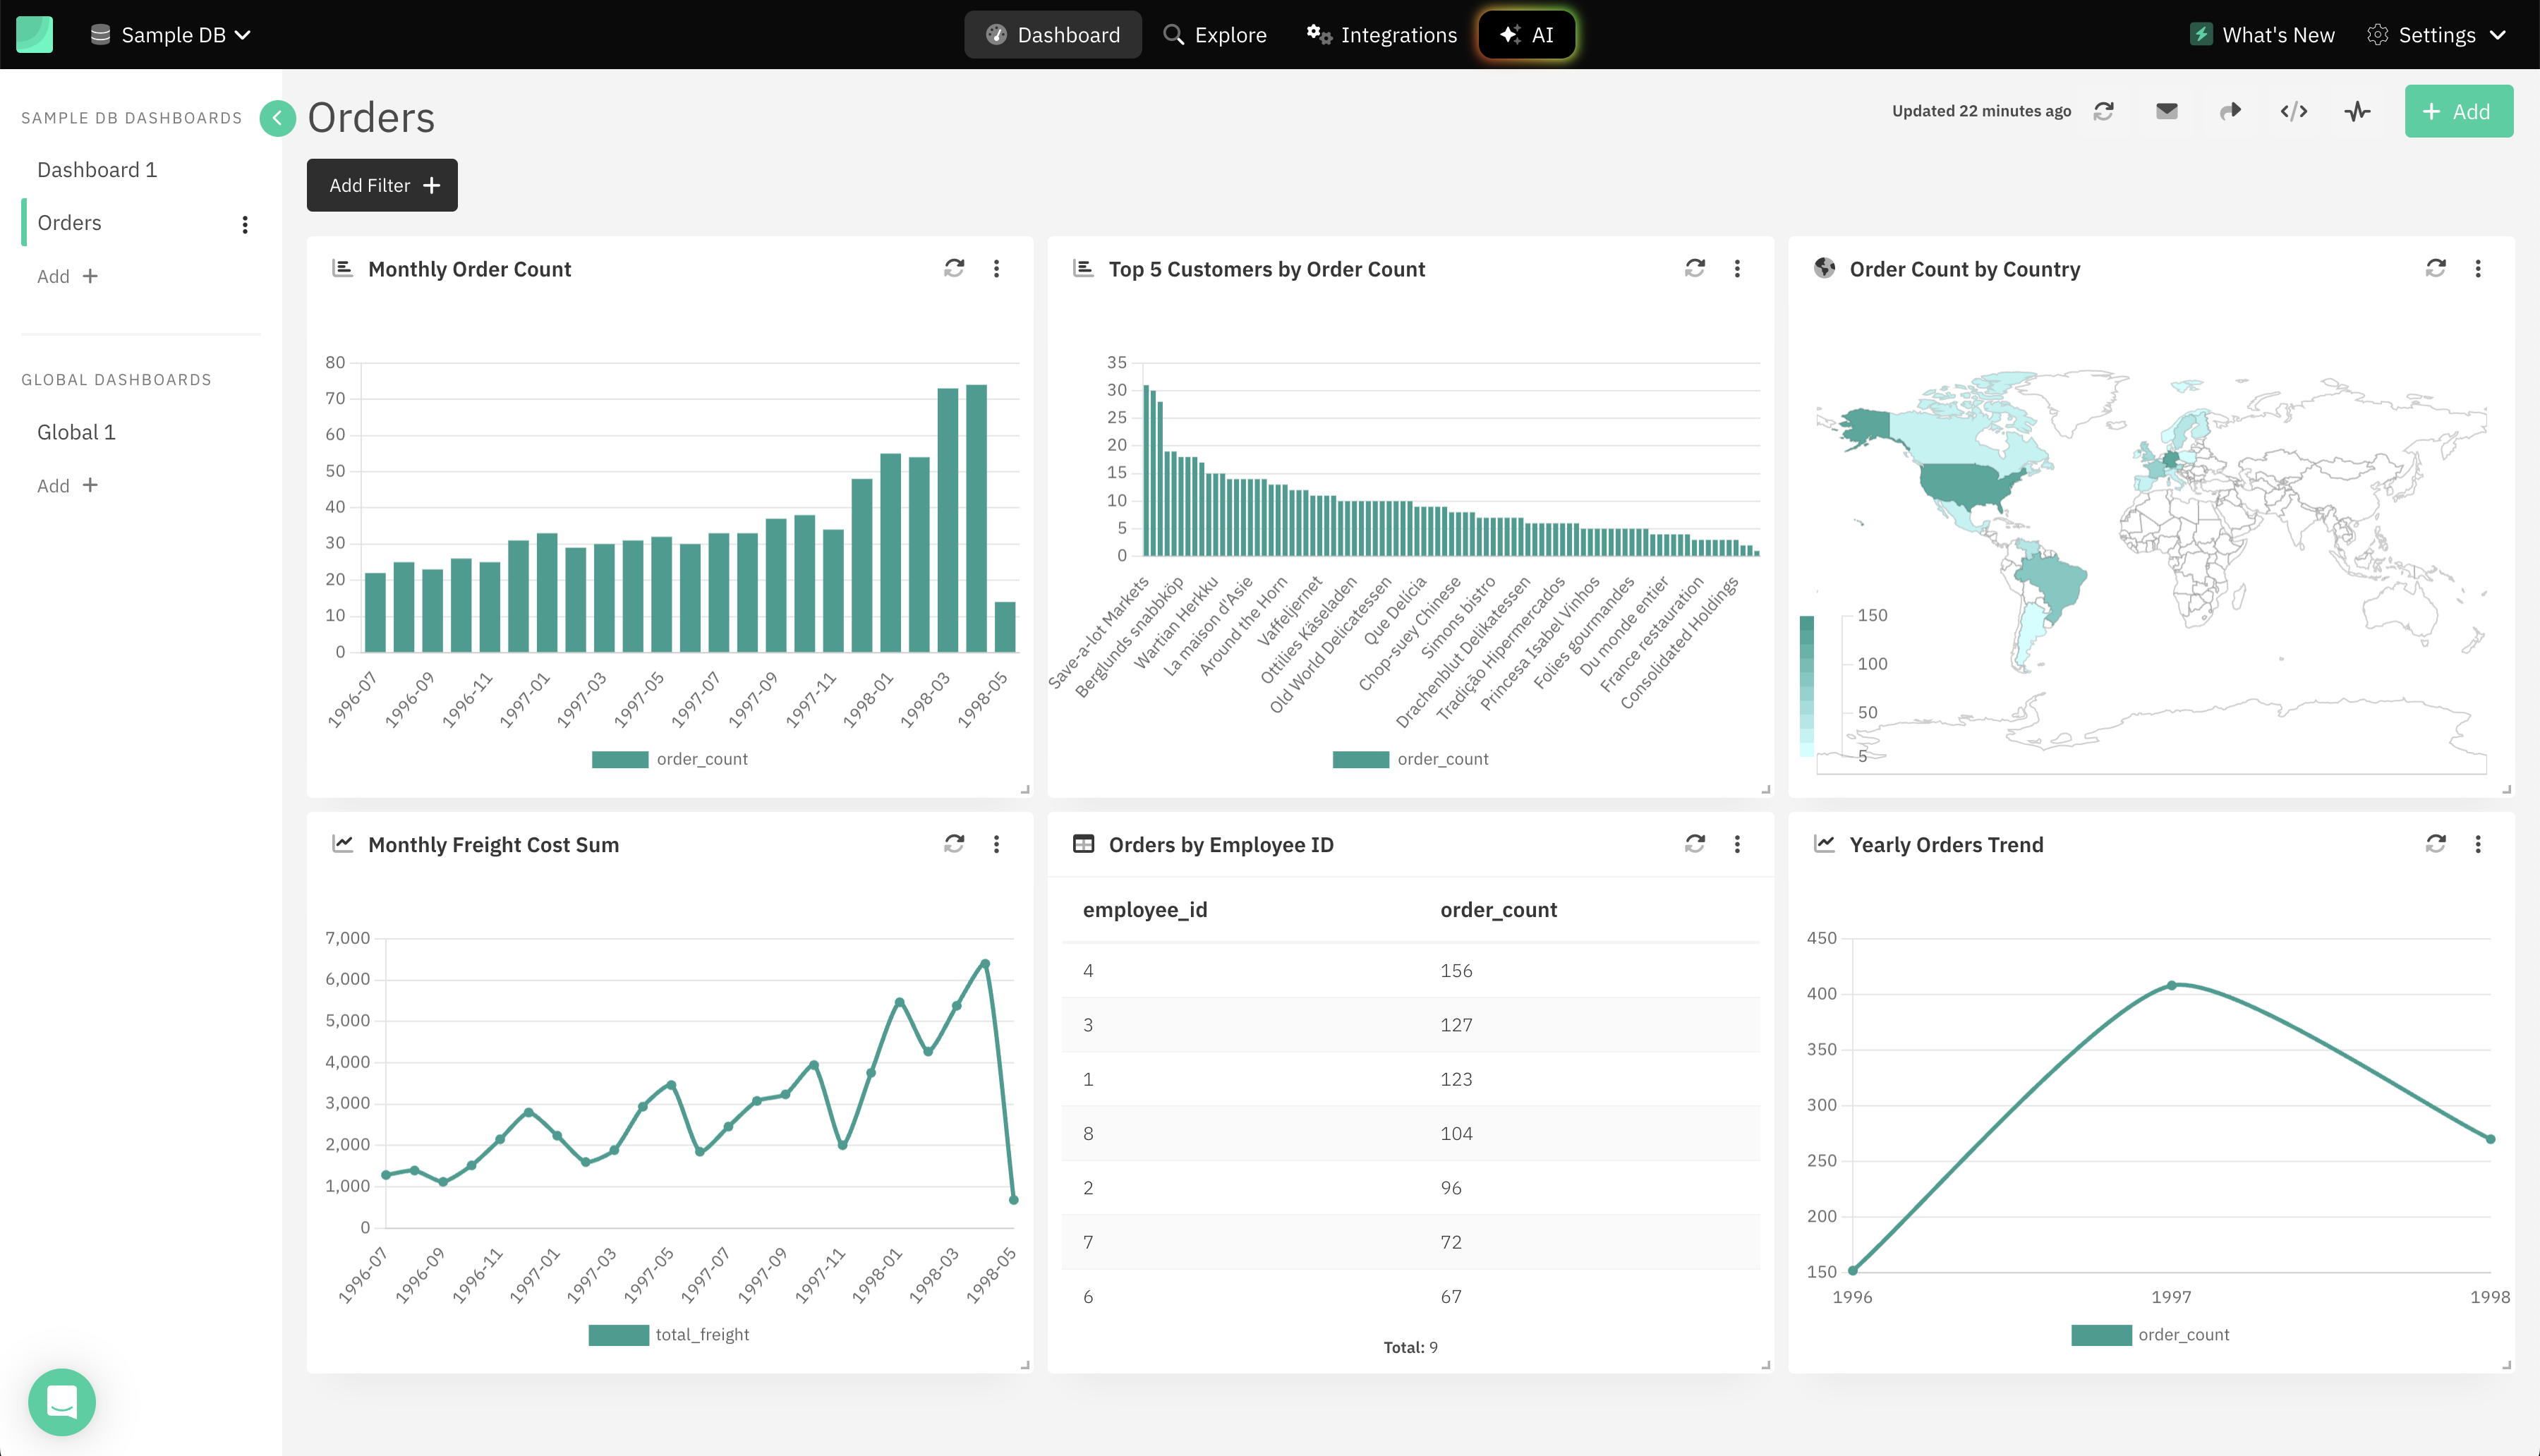
Draxlr AI will analyze the requirements, generate up to six dashboard items, and add them to your dashboard.
-
You can choose to keep the dashboard items that fit your requirements; you can also re-run the process to generate more insights.
Conclusion
In today's data-driven world, the ability to quickly and effectively transform raw data into actionable insights is crucial for business success. Draxlr's AI-powered capabilities for generating SQL queries and entire dashboards revolutionize how organizations interact with their data, making sophisticated analytics accessible to all users.
By leveraging AI to automate and simplify complex processes, Draxlr not only enhances decision-making and performance tracking but also fosters a culture of collaboration and continuous improvement. As businesses continue to evolve, tools like Draxlr will be instrumental in driving efficiency, innovation, and strategic growth.
Start building your AI-powered SQL dashboards with Draxlr today and take your data analysis to the next level. Draxlr offers a free trial. Sign up today.
FAQs
-
What is the AI tool for SQL query optimization?
The article references Draxlr as an AI tool for SQL query optimization. It uses AI to help generate SQL queries and provides suggestions for SQL queries with issues.
-
How to create a dashboard from SQL?
To create a dashboard from SQL using Draxlr, you can leverage its AI-driven feature by providing a list of tables and a brief description of your dashboard requirements. Draxlr will analyze the data structure and relationships to generate comprehensive dashboard items quickly. This process involves clicking on the AI option, providing instructions or tables, and letting Draxlr generate the necessary visualizations.
-
Can AI create dashboards?
Yes, AI can create dashboards. Draxlr's AI-driven feature allows users to generate entire dashboards by simply providing a list of tables and a brief description of the required dashboard. The AI intelligently designs visualizations that best represent the data, making it easy to obtain actionable insights without manual effort.
-
Can AI create a SQL query?
Yes, AI can create a SQL query. Draxlr enables users to generate specific SQL queries by providing natural language instructions to its AI. The AI interprets these instructions and generates the corresponding SQL query, which can then be visualized in various formats such as tables or graphs.
-
What are dashboards?
Dashboards are visual tools that display key metrics and data in an organized, easy-to-read format, often using charts and graphs. They provide a quick overview of important information, helping users monitor performance and make informed decisions in real time.
-
Why do we use dashboards?
We use dashboards because it transforms raw data into actionable insights, enhancing operational efficiency and strategic planning.
- Vivek
