How to build Dashboards from ClickHouse data
Learn how to build dashboards from ClickHouse data using Draxlr's no-code BI tool. Connect, query, visualize, and share your data effortlessly.

ClickHouse is a fast and highly efficient columnar database management system.
Top 8 features of ClickHouse:
- High Performance: Remarkable speed, capable of processing billions of rows and petabytes of data per second.
- Columnar Storage Format: Efficiently stores data by columns, allowing for substantial compression and quicker data access.
- Scalability: Supports both vertical and horizontal scaling to manage large datasets and high query loads in distributed clusters.
- Real-time Data Ingestion: Enables immediate data processing and analysis, making it ideal for real-time applications.
- SQL Compatibility: Utilizes a familiar SQL query language, making it user-friendly for those experienced with SQL databases.
- Advanced Compression: Employs sophisticated compression algorithms to minimize storage requirements and enhance I/O performance.
- Distributed Query Processing: Efficiently distributes data and executes queries in parallel across multiple nodes for improved performance.
- High Availability: Ensures data consistency and system reliability through data replication and automatic failover mechanisms.
Using Draxlr to build Dashboards from ClickHouse data
Draxlr is a no-code BI tool that allows you to create dashboards, receive data alerts, and embed dashboards on customer-facing websites.
Draxlr has partnered with ClickHouse to allow ClickHouse users to build dashboards and get data alerts.
Here is a quick video walkthrough of how to build a dashboard from ClickHouse data in Draxlr:
Ok, let's get started.
Connecting ClickHouse with Draxlr
In ClickHouse, you can have multiple organisations, and each organisation can have multiple projects. Each project has a Postgres Database. You can connect to a ClickHouse project database to generate insights into your data.
-
Login into Draxlr, visit the Add Database page, and select ClickHouse.

-
Select the platform where your ClickHouse data is hosted. For this guide, let us assume you select ClickHouse Cloud.

-
You will see a form to provide the database credentials.
To get the database credentials login into your ClickHouse account and visit https://console.clickhouse.cloud/.

-
ClickHouse Cloud can have multiple services under an organization, select the service which you want to connect.

-
Click on Connect in the sidebar.

-
On the Connect popup, select MySQL and copy the credentials to the Draxlr screen and hit Next.

-
You can now select the database schema; by default, it is default.

-
Now you can see the list of tables, and you can start exploring your data.

Generating Queries and Visualizing the data
After connecting ClickHouse with Draxlr, you can create dashboards from your ClickHouse data.
- Utilize Draxlr's no-code query builder to generate data with filters, joins, sorting, summarizing, and grouping options.
-
Visualize the resulting data using various graph options such as bar, pie, line, area, tree-map, box-and-whisker, and more.

-
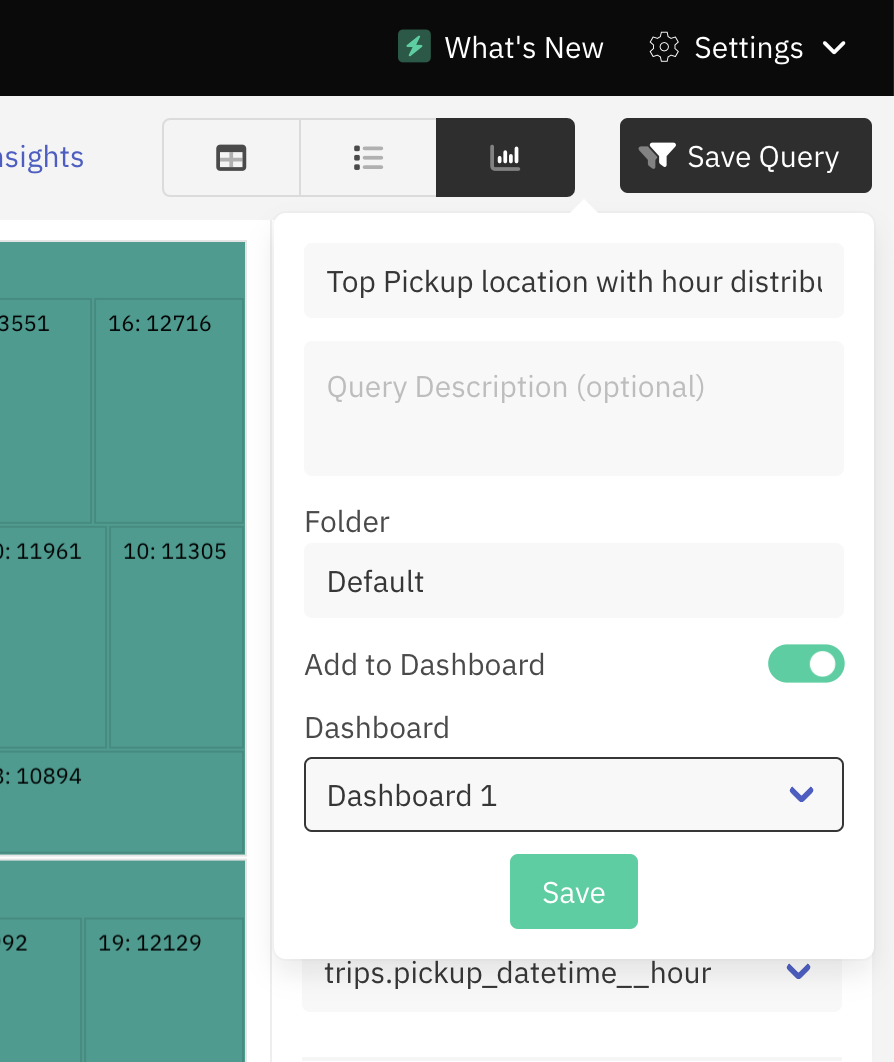
Once your graph setup is complete, save the query and add it to a dashboard.

-
Your dashboard is now ready!

- Share the dashboard with your team and embed it in your customer-facing application.
Building dashboards from ClickHouse data with Draxlr is a straightforward process that leverages the power of both platforms. ClickHouse’s exceptional speed and scalability, combined with Draxlr's user-friendly interface and powerful visualization tools, enable you to gain valuable insights quickly and efficiently.
Whether you are managing large datasets or need real-time data analysis, this guide equips you with the knowledge to create and share dynamic dashboards that can enhance decision-making and drive business growth.
- Vivek

