How to build MySQL Dashboards from MySQL data
Build MySQL dashboards from MySQL data. Learn how dashboards for MySQL help track growth, churn, and product metrics to make faster business decisions.
A MySQL dashboard gives teams access to real-time data they need to make better decisions. But without it, metrics stay buried in a database, and every update requires engineering help. You wait longer to spot trends, track progress, or respond to changes. That delay adds up. Visibility shouldn't be a bottleneck.
Here’s what usually happens without a MySQL dashboard:
- You wait for a developer to run a query
- The numbers arrive hours or days later
- By then, the moment to act may have passed
Your business metrics should be available on demand, not behind a request queue.
Dashboards for MySQL solve this by turning raw data into live, accessible insights without waiting on someone to write a query every time you need an update. Whether you're tracking product usage, customer metrics, or operational KPIs, MySQL dashboards give everyone a clear view of what’s happening, as it happens.
This guide covers two ways to build MySQL dashboards from your MySQL data:
- Build it yourself(if you have time).
- Or use a BI tool like Draxlr to save time and build dashboards for MySQL.
First, a quick look at MySQL
MySQL is the most popular open-source relational database management system (RDBMS) that simplifies data management with structured tables, relationships.
Key features of MySQL are:
- Uses structured tables to store and manage data.
- Open source.
- Handles large databases with support for indexing, partitioning, and replication.
- Cross-platform compatibility.
- Supports standard SQL syntax for queries and data manipulation.
- JSON support.
How to build MySQL dashboard with your own code
If you have engineering resources and want full control, you can build MySQL dashboards directly from your MySQL data using backend and frontend charting libraries. This approach gives you flexibility in design, logic, and hosting.
In fact, many teams choose to build dashboards for MySQL from scratch when they need deep customization, tight integration with internal tools, or full control over how data is queried and displayed.
Here’s what the process typically involves:
- Writing backend code (using Rails, Node.js, Django, etc.) to query your MySQL database.
- Processing the results into the format your frontend can use.
- Using libraries like D3.js to display visualizations in your app or internal tool.
While this gives you full control, it comes with trade-offs:
- Requires time from your dev team.
- Needs ongoing maintenance
How to build MySQL dashboards using Draxlr
Draxlr is a self-serve BI solution for dashboards, automated data change alerts, and embedded analytics on customer-facing platforms.
Here is a quick video walkthrough of how to build a MySQL dashboard from MySQL data in Draxlr:
Connecting MySQL with Draxlr
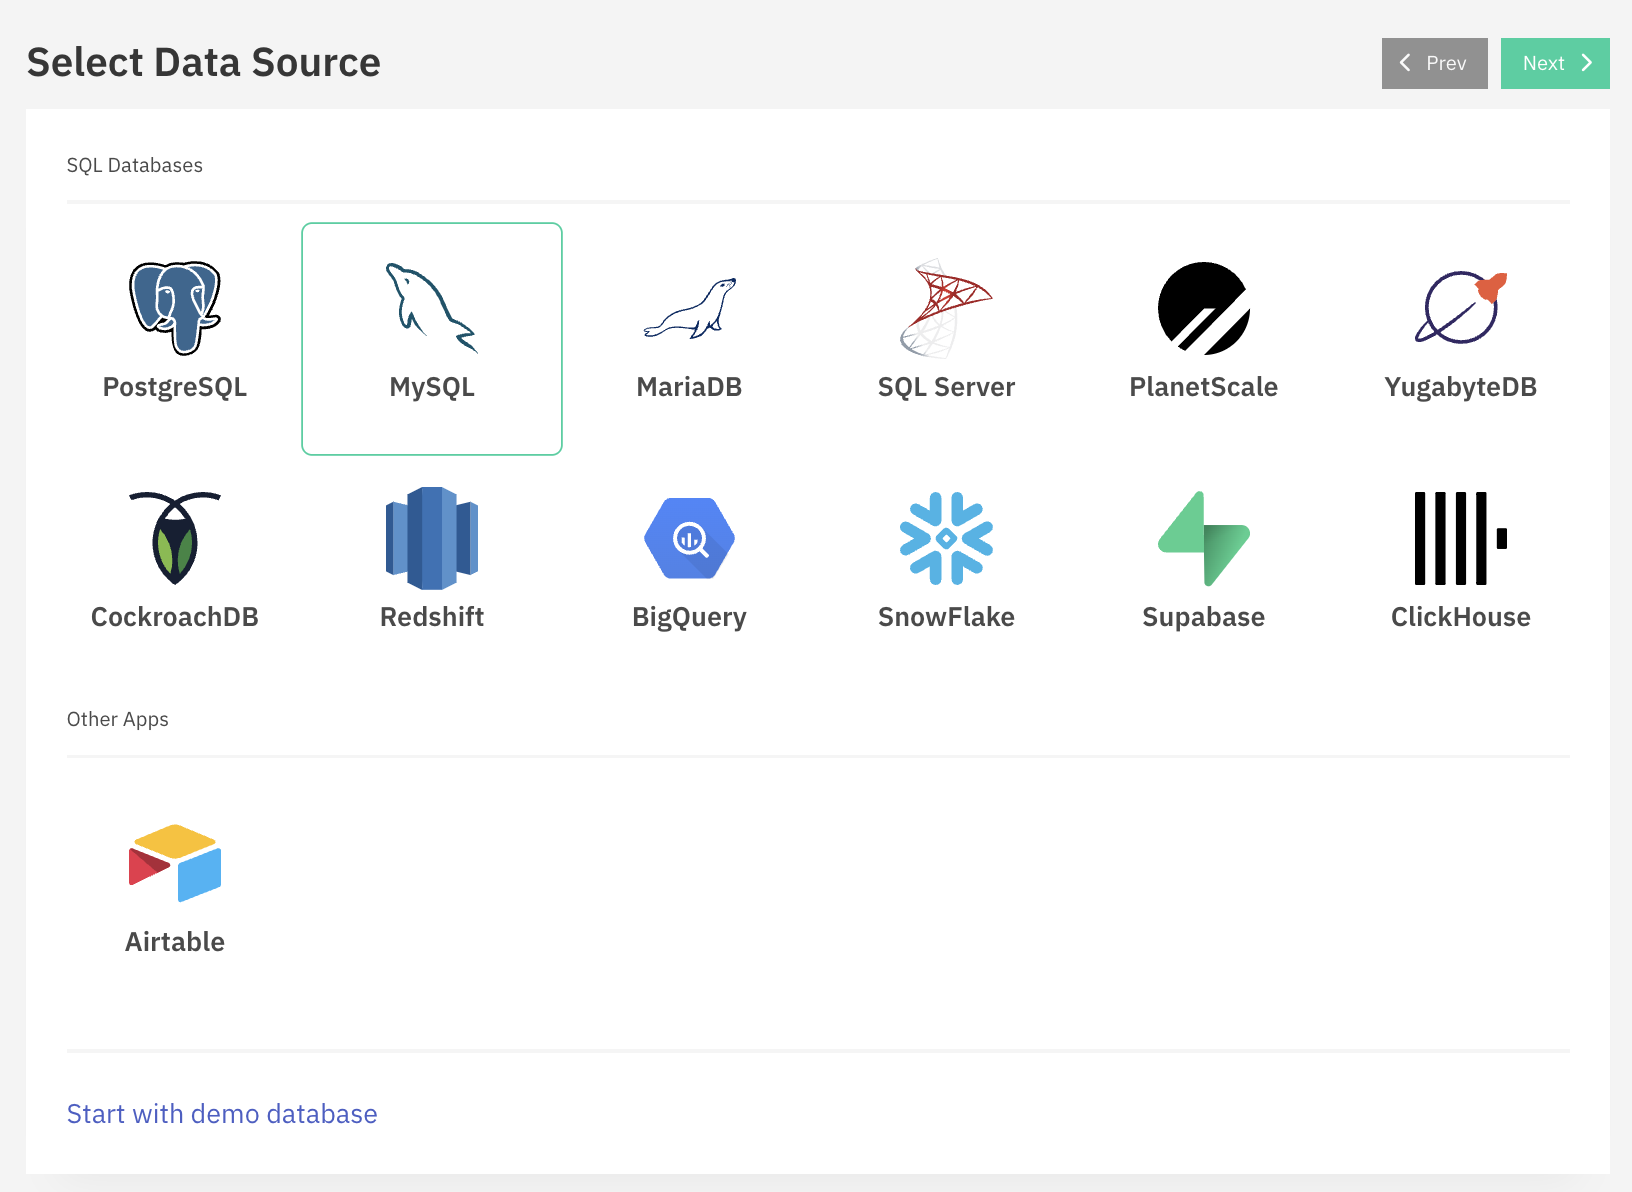
- Login into Draxlr and navigate to the Add Database page.
-
Select MySQL from the available database options.
-
Add the MySQL database credentials into respective fields.

-
Once the correct details are added, Draxlr syncs the data and helps you create a chart by selecting a table and defining the x-axis and y-axis values.

-
Once the table and axes are selected, Draxlr generates the first saved query, adds it to the dashboard, and sets an alert as a part of smooth onboarding.

How to build queries and visualize MySQL data using Draxlr
Building a query is the first step in creating MySQL dashboards, setting alerts, and embedding insights. Draxlr offers three ways to generate queries from MySQL data:
- Query Builder – A no-code simple interface for defining queries using point-and-click actions.
- Raw SQL – A SQL editor for writing complex and custom queries manually.
- AI-powered SQL Generation – A natural language interface that translates English inputs into corresponding SQL queries.
Example: Query Builder
Let's consider an example to find the number of products in each category,
- Let's build the above query with Draxlr's no-code query builder
- Choose Categories as the table.
- Apply a LEFT JOIN with the Products table.
- Group by Category Name.
- Functions products count.
- Click Execute, and you’re done!
-
You can now visualize the MySQL data with various chart options, including bar, pie, tree map, and more and also modify them with various customization options.

-
Once the query is saved with the desired MySQL visualization, you can add it to the dashboard and set-up data change notifications on Slack and/or email.
-
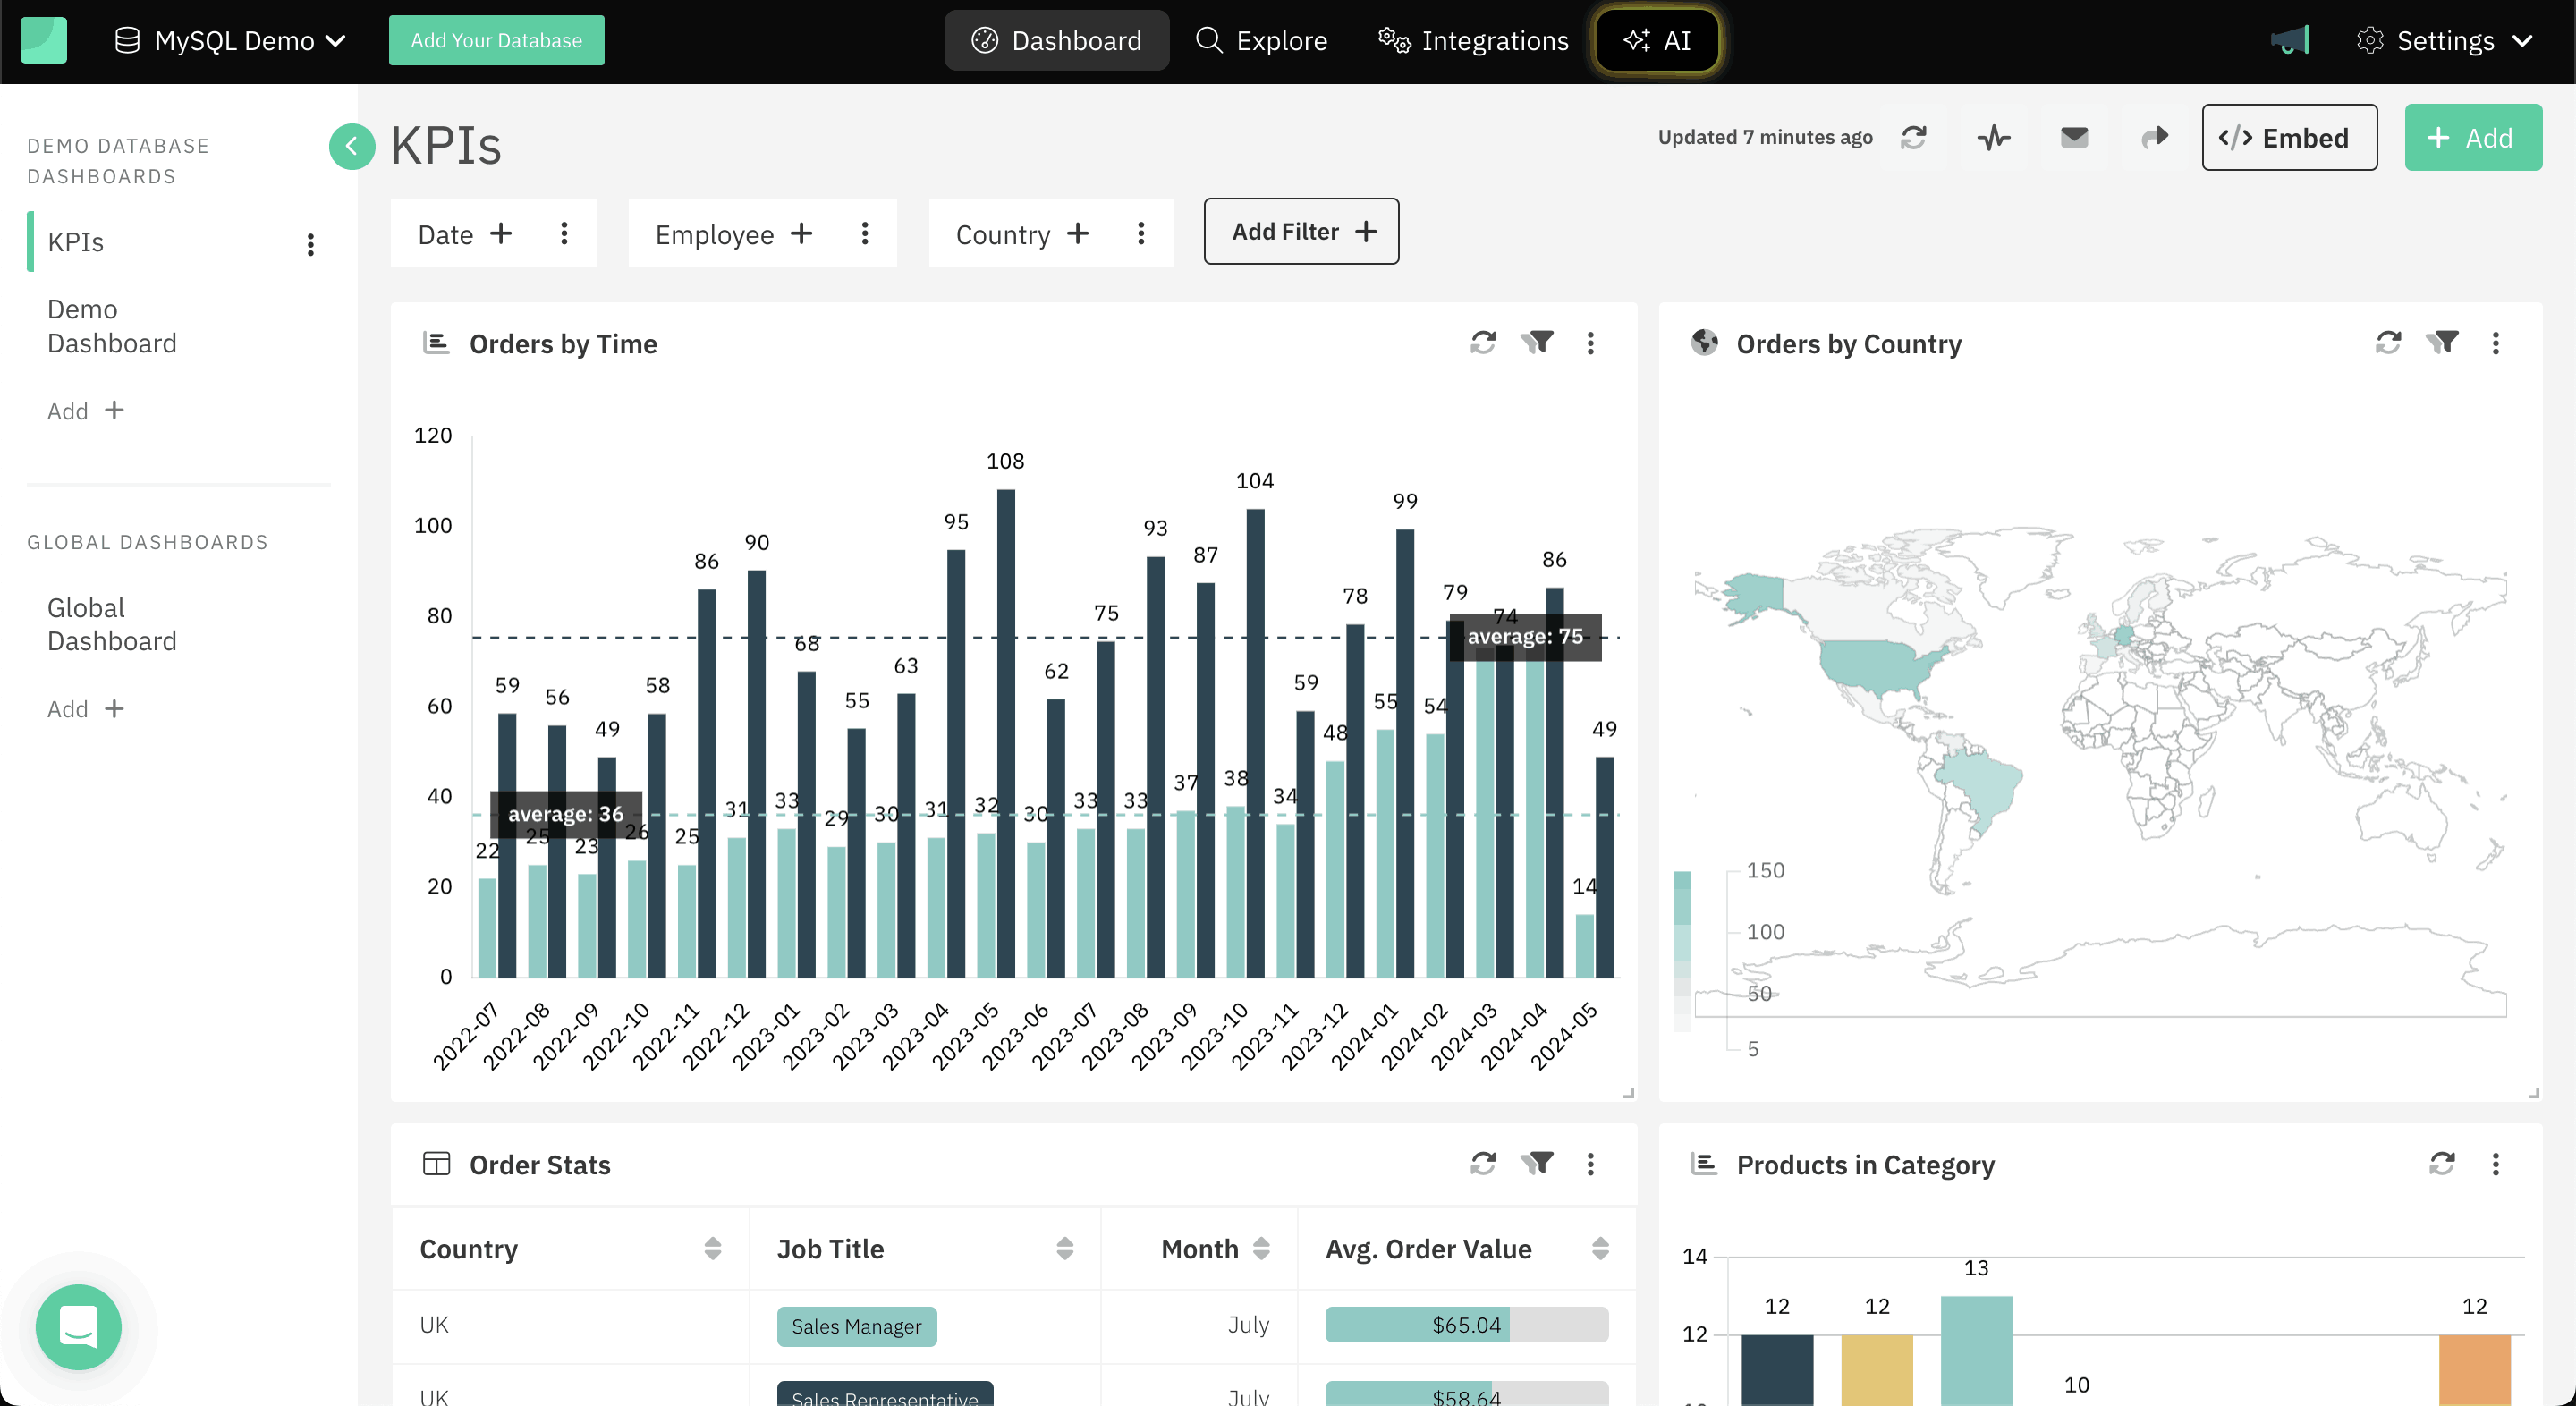
And your dashboard is ready!
-
You can make the dashboard accessible to your team and embed it into your customer-facing app.
Top metrics to track in your MySQL dashboard
Once your data is connected to a MySQL dashboard, these are the metrics you’ll want to see first. They reflect growth, engagement, and drop-offs—the areas that matter most to all the teams.
- New Signups (Daily/Weekly/Monthly)
- Trial-to-Paid Conversion Rate
- Net Revenue Retention (NRR)
- Monthly Recurring Revenue (MRR)
- Customer Lifetime Value (LTV)
- Daily Active Users (DAU)
- Most used features
- Drop-off points
- Number of uninstalls
Conclusion
Creating MySQL dashboards from the data doesn’t have to be complicated. If you have engineering resources, building your own with code is always an option. But if you want to save time and start tracking key metrics right away, Draxlr offers a faster, more flexible way to get there.
With advanced charts, drill-down capabilities, and real-time filters, Draxlr helps you move from raw data to clear insights without writing and maintaining custom code.
Connect your MySQL DatabaseWhichever path you choose, the most important thing is to make your data visible. Because the sooner you can see what’s working (and what’s not), the faster you can make smarter decisions.
FAQs
1. How to create a dashboard in MySQL?
MySQL itself doesn’t have built-in dashboard interface. To create a MySQL dashboard, you need to connect your MySQL database to a visualization layer. This can be done with a tool like Draxlr that connects directly to your MySQL database and lets you build dashboards without writing code.
2. How to visualize data from MySQL?
To visualize MySQL data, use Draxlr, which connects to your database and lets you build MySQL dashboards with advanced chart types like Sankey, Donut, Heatmap, funnel, etc and explore trends using drill-down and drill-through. You can filter data in real-time and track key business metrics without needing engineering help, making it ideal for small to mid size teams.
3. What is the data visualization tool for MySQL?
There are various tools that can visualize data from MySQL, depending on your technical preferences. Some are code-based, requiring you to build the logic and visuals manually. Others, like Draxlr, are purpose-built to work with MySQL and let you build dashboards quickly, define metrics easily, and share insights with your team. The best tool depends on your need for speed, customization, and engineering effort.