If you Google the importance of data for any business, you will realize that it is indeed the most valuable asset for any organization. Right from customer acquisition to customer retention and value addition, you need to know which direction needs more work and which one is already showing results. Data is the backbone for any strategic planning that you would necessarily do for your organization, and that is where the SQL queries come into the picture. Don't fret if coding and querying are not your forte, because we are here to solve that for you. Who said you needed to know these in order to deep dive into data—not us!
The more information you have, the better you know your customers, and the more you can focus on building a better product. However, with great data comes great responsibility—managing it, sorting it, analyzing it, and optimizing it for your use. If you’re wondering about the possible operations that can be done on data, let us summarize a few of the crucial ones below for you. Nonetheless, there’s good news before we move ahead: with Draxlr, you can let them handle your data, and you can just focus on results! Sounds great, doesn't it?
Pre-requisites
Before moving on, you would need to connect your database with Draxlr. Once you register on the website, you can choose from a variety of database types—MySQL, PostgreSQL, MariaDB, and many more. After the same, you can provide the connection details, like your host and name, or you could also link the connection string (you can ask the developers in your team to help you get it). You might need to whitelist the IP of Draxlr in cases where you have a private connection to the database. Once your connection is tested and ready to use, Draxlr will fetch the tables from your database, and you can begin performing the operations listed below.
Filtering
To put things in a simple way, filtering means separating the data on the basis of something. In a database consisting of data from fifty students, you could filter by gender, birthday month, height, marks, and whatnot. Not only does filtering make the analysis easy, but it also allows us to do operations on the basis of filter groups rather than on a single record, which saves a lot of time.
For example, you could filter all students who scored greater than 80% marks and send them a nice motivating email.
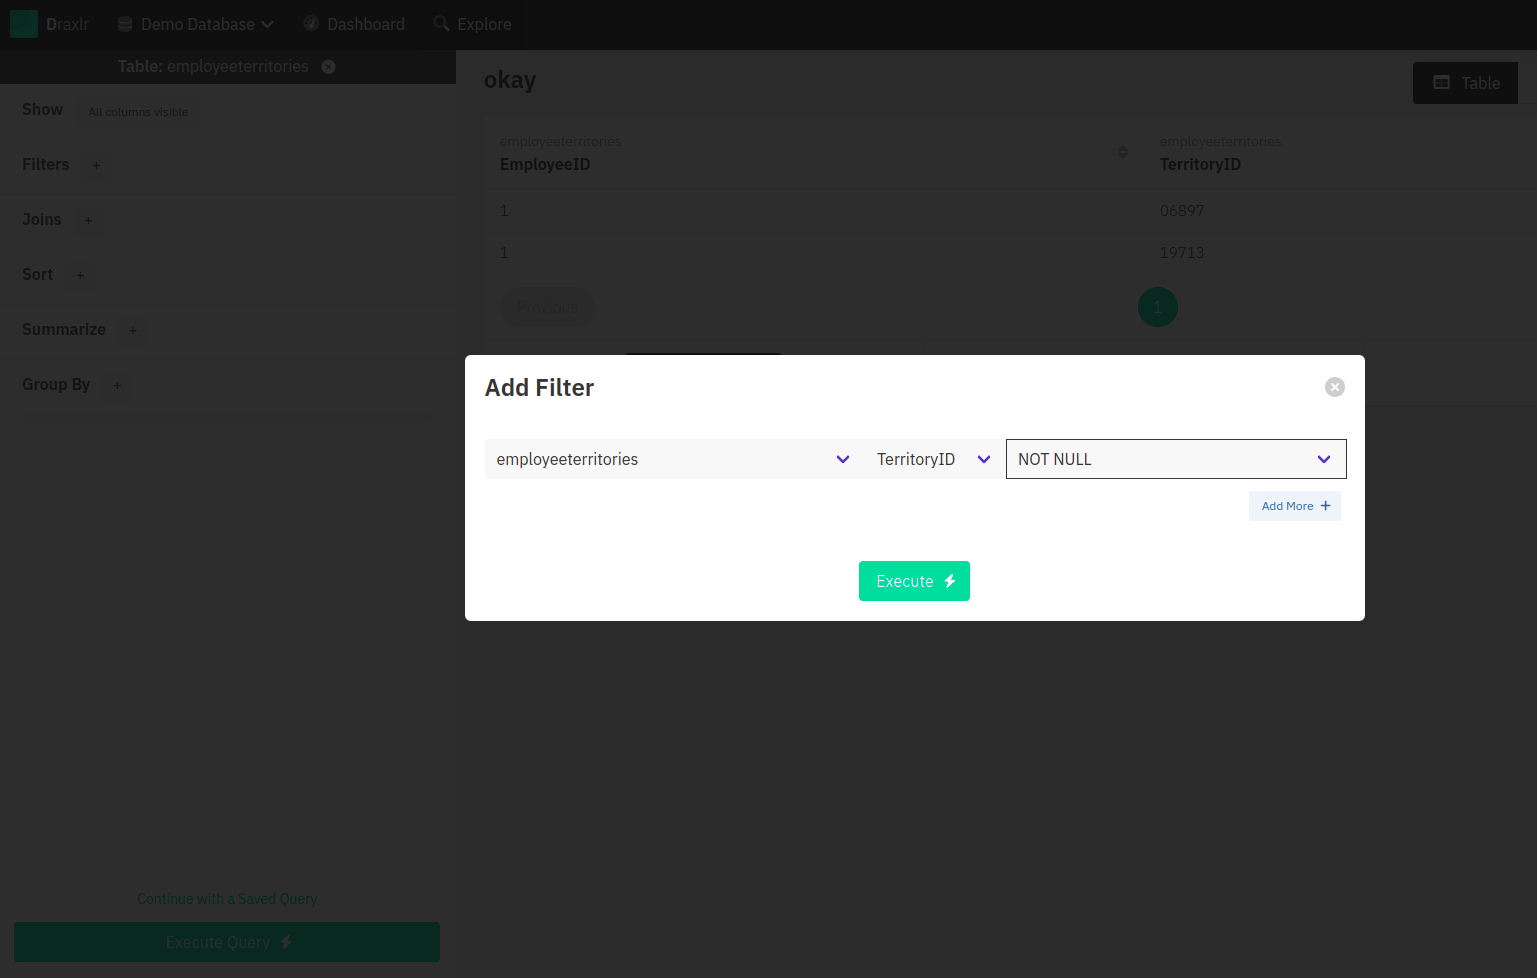
You can perform a lot of operations on the filter, as you can see in the image below. All you have to do is select a table, choose a column on the basis of which you want to filter, and choose what filter you want to use—that's it!
Sorting and ordering your data
In the same class of fifty students, if you had to find out the top three students, the traditional way would be to go through all the records of the students and figure out the same. This method is prone to errors, tiring, and unreliable. With Draxlr, sort and order are as simple as any other SQL query, and you don't even have to worry about how to build the query; it is as simple as a few clicks.
To sort and order a table, you need to know two things: which column you want to sort and in which order (ascending or descending). Once you select those from the drop-down, this is how your query would look:
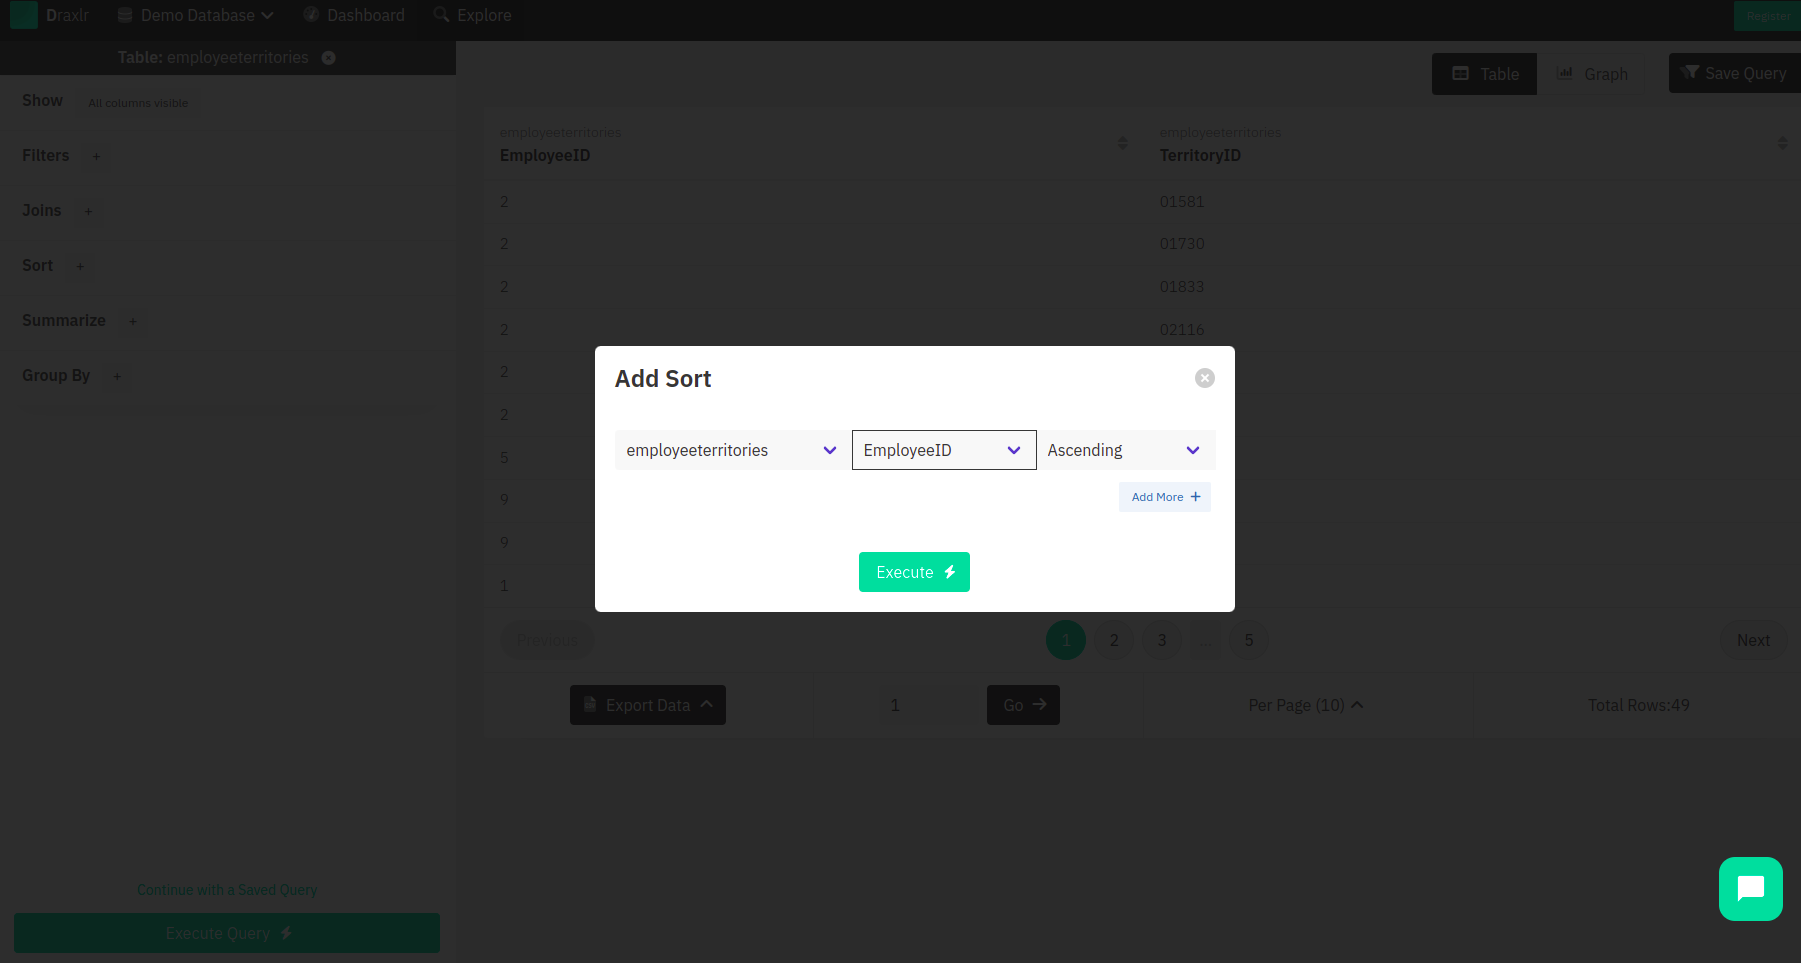
Now all you have to do is click on execute and sit back. Draxlr will take care of the data processing, and you will see results in a few seconds.
Combine data from multiple tables
Sometimes, querying just one SQL table doesn't suffice. Due to integrity and consistency reasons, data is usually split into two or more tables so that it doesn't repeat or cause any problems when updated or deleted. To be clearer, if you store the same field in two or more tables, you would have to update both of them when needed, and if you forget to update any one of them, the data will be inconsistent.
In the class of students, we might also need to store the parents’ details. For the same, we create a separate parent table and store their numbers, addresses, and all other information. We connect this table to the student table with a foreign key, i.e., every primary key (the ID of the students’ table) will also be a key (foreign key) in the parent table. This way, you can easily find out which parent record belongs to which student by looking at the IDs.
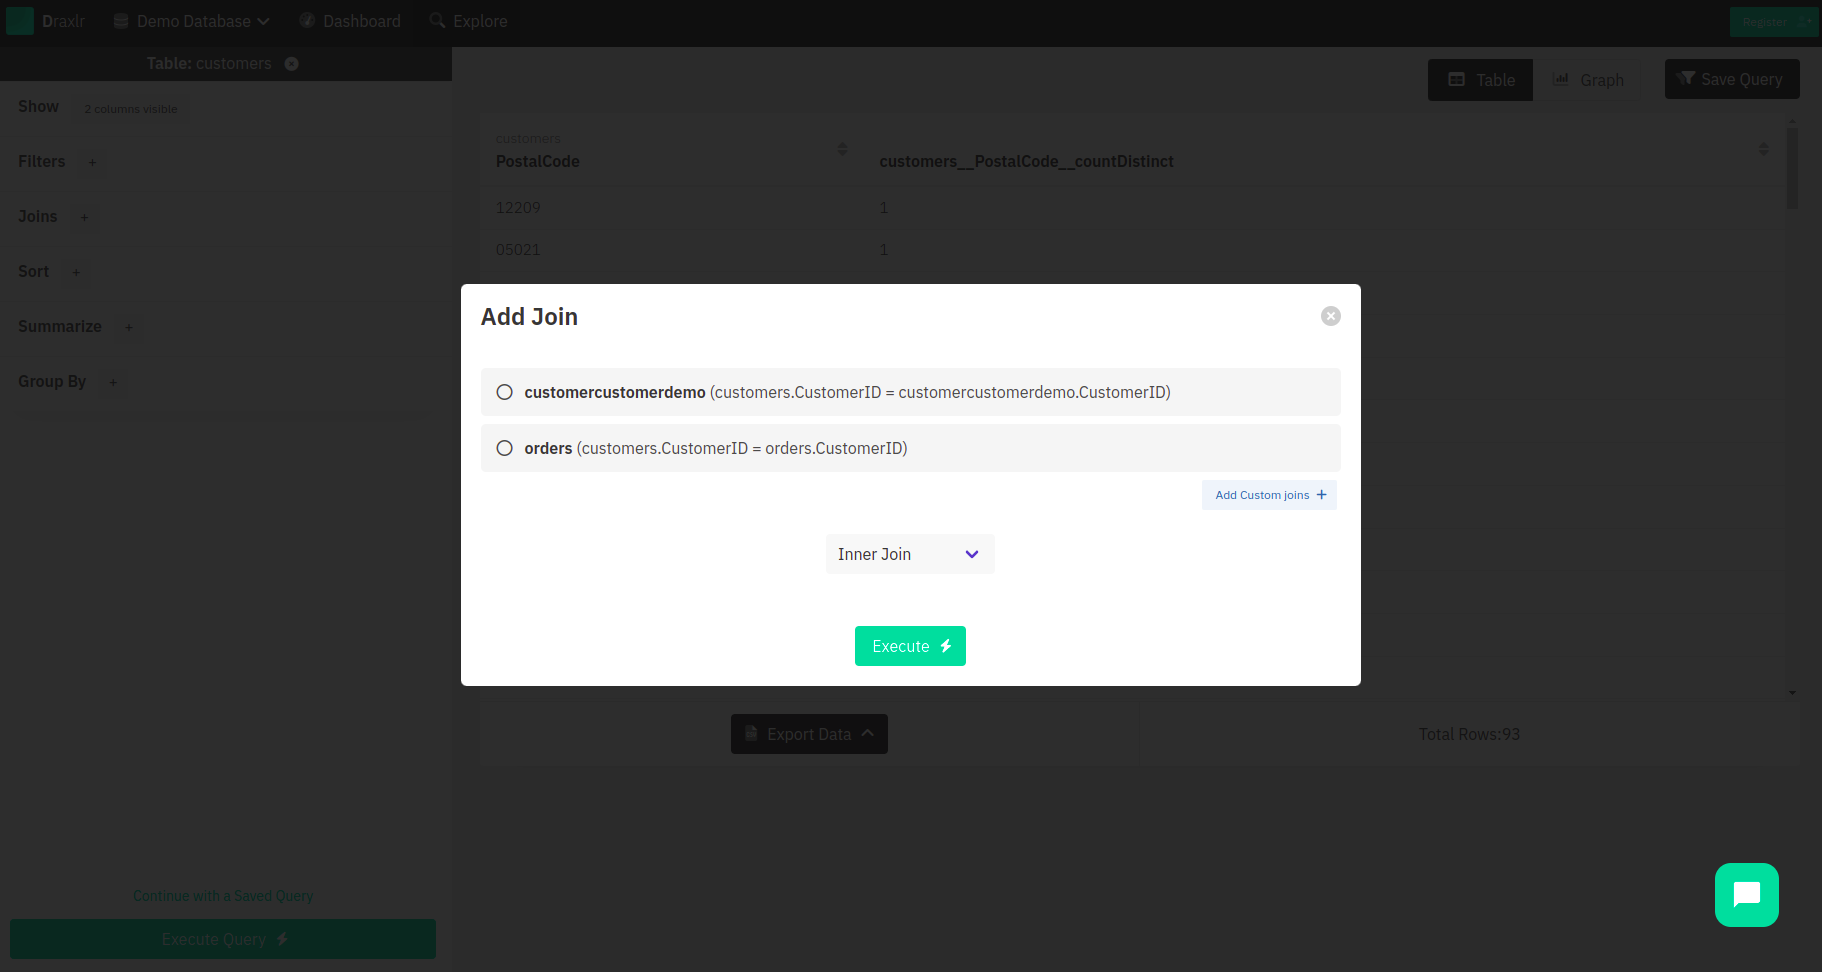
With Draxlr, you need not worry about how to join the two tables or how to create this complicated SQL query. With a few clicks, you can easily select the two tables that are linked by the foreign key and select what kind of join you want to use to join them. Below is a brief explanation of the kinds of joins present on Draxlr. We can assume that we are joining Table A with Table B.
- Inner Join: This join selects records that have matching values in both tables. No extra records will be fetched.
- Right Join: This join fetches all records from the right table (Table B) and the matching records from the left table (Table A). If there are no matching records, it will return all records from Table B and none from Table A.
- Right Outer Join: This join in a SQL query is used to fetch all the matching records from both the tables involved in the join as well as all the non-matching records from Table B. This is virtually the same as Right Join.
- Left Join: This join fetches all records from the left table (Table A) and the matching records from the right table (Table B). If there are no matching records, it will return all records from Table A and none from Table B.
- Left Outer Join: This join in a SQL query is used to fetch all the matching records from both the tables involved in the join as well as all the non-matching records from Table A. This is virtually the same as Left Join.
- Full Outer Join: This join selects all the records where there is a match in the left (Table A) or right (Table B) records.
- Cross Join: This join returns the Cartesian product of rows from the tables. It combines each row from Table A with each row from Table B. Simply put, it returns all the records from both tables.
Now that you are well versed in the different kinds of joins, you can easily put them to use. When you use Draxlr, you need not worry about the syntax or the execution; all you need to select is the kind of join you want and the tables that you want to join, and you’ll be served the results! Below is how you can execute the same.
Summarize your data
Summarizing the data is as important as analyzing it. To know the number of unique records, or simply the records in the database, you can choose to summarize them. And yes, you don't have to count each record—with Draxlr, it is as simple as selecting the table, selecting the column from which you want to fetch the count, and hitting execute! You can look at the image below as a reference:
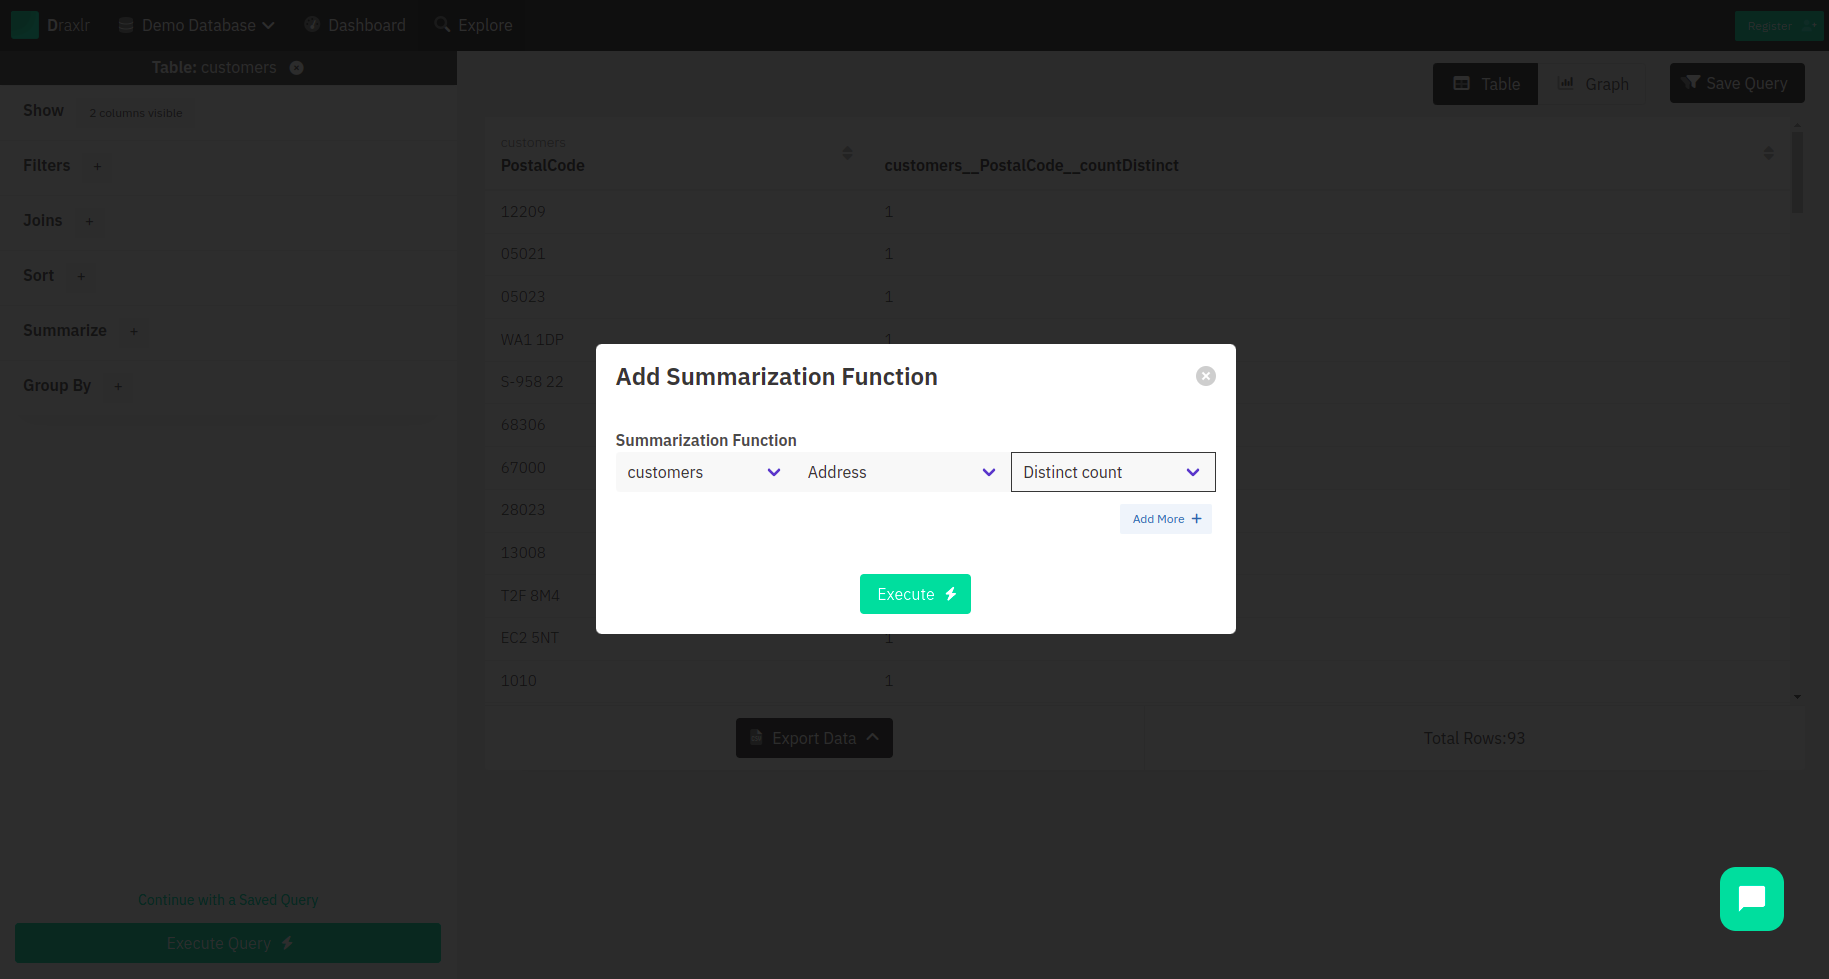
Apart from counting the total number of entries, you can also summarize them in other ways. For all your numerical fields, you can perform additional operations like getting the average of a column, the minimum, the maximum, and the total sum of all the entries for any column.
Group results
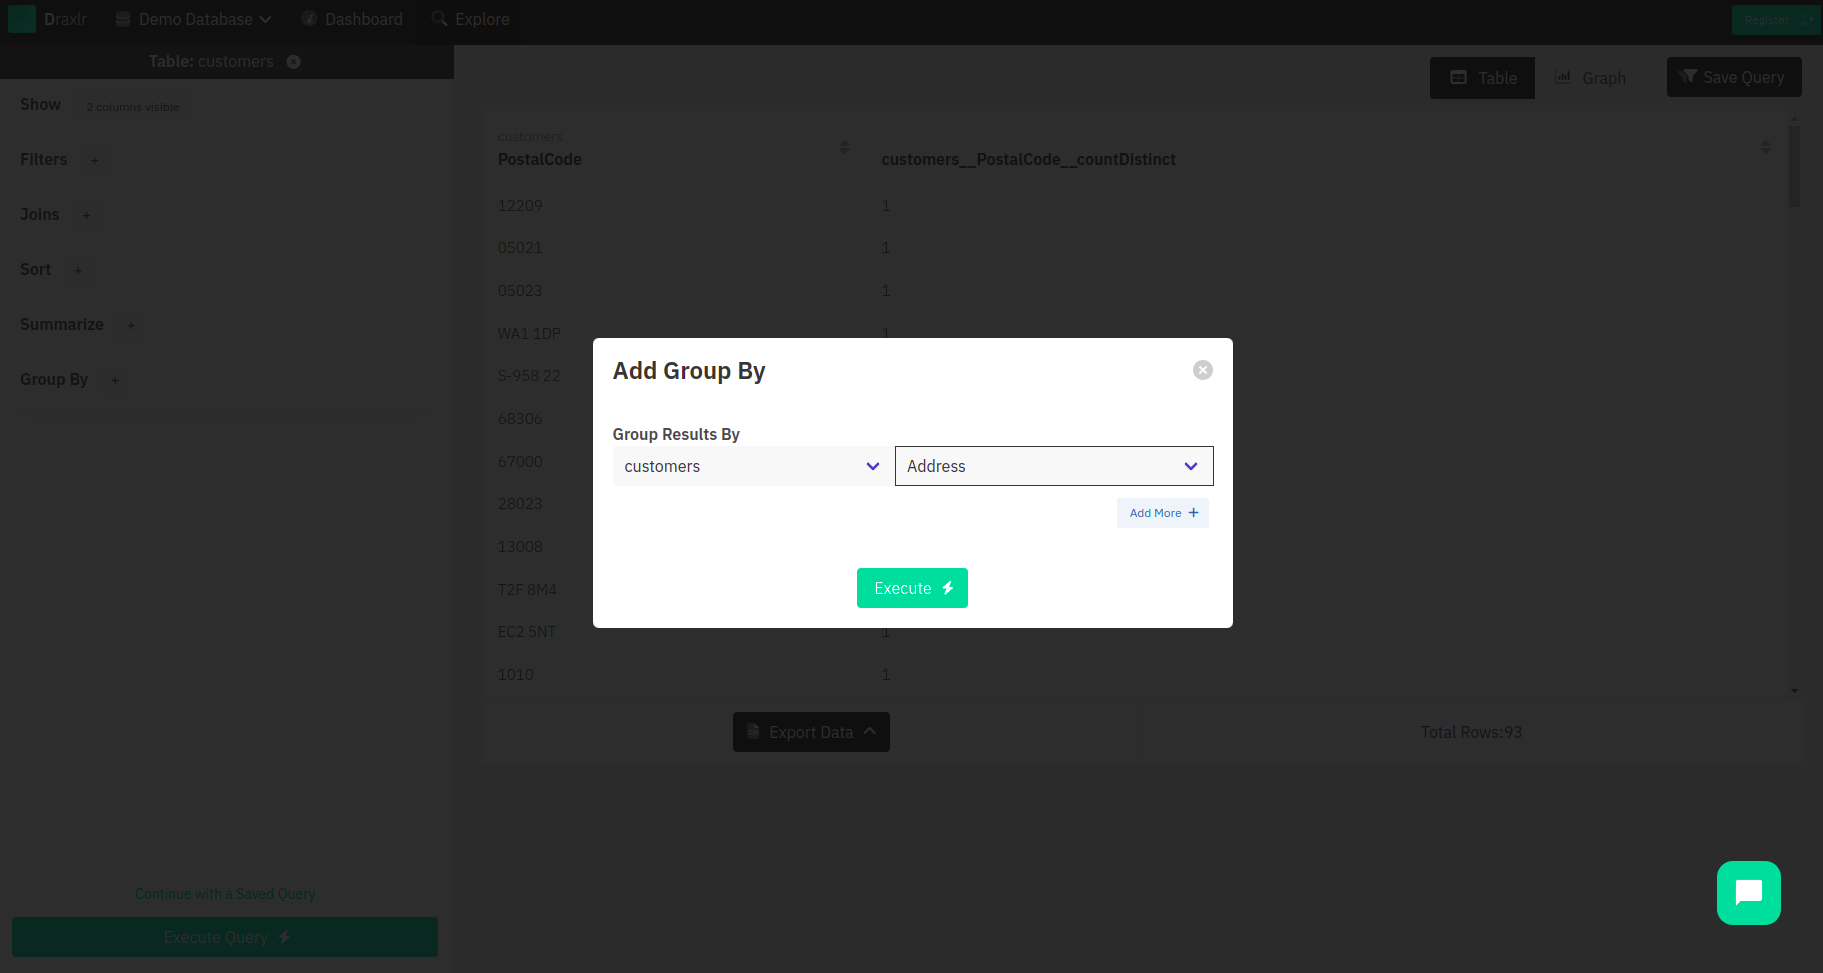
To explain briefly, this operation involves grouping the data on the basis of some parameter. In a class of students, if you want to know how many students have opted for science or math, you can group the students by the subject and get the number of students that have opted for it. On Draxlr’s platform, you need to select the table and the column on the basis of which you want to group the data.
Wait, there's so much more!
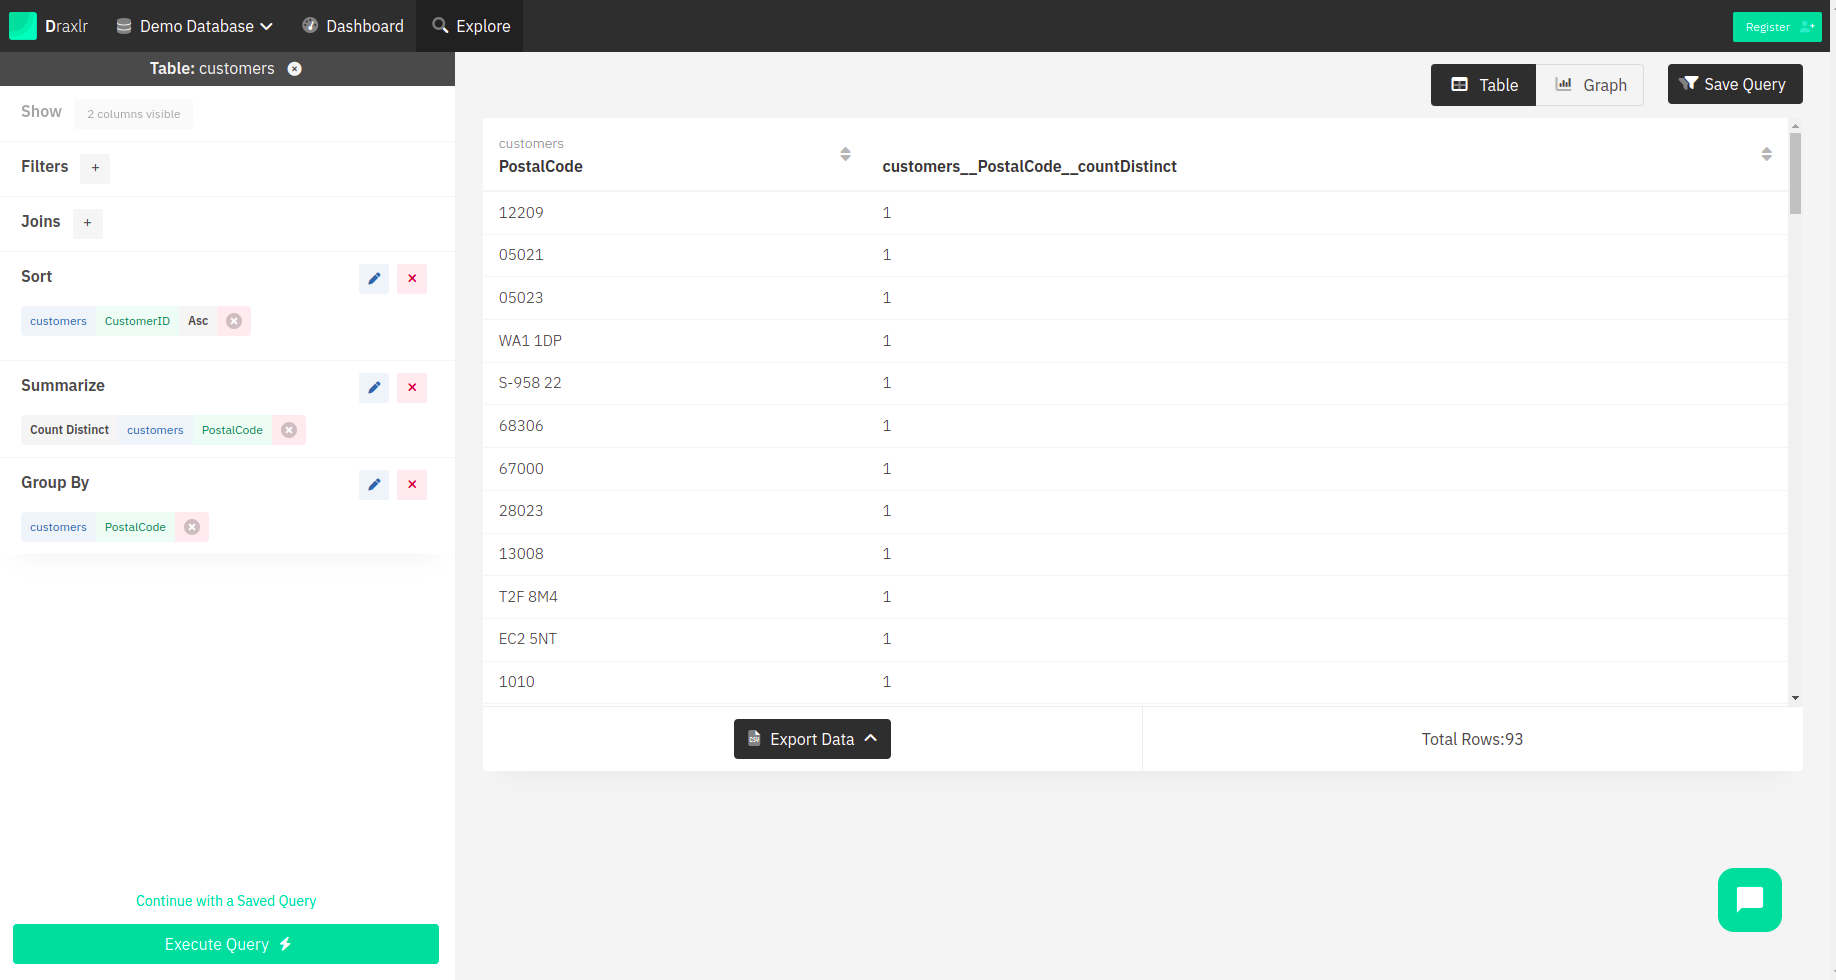
Now that you know that performing the above complex database queries is actually so simple with our tool, what if we tell you that there's more? Not only can you perform these queries individually, but you can also use more than one SQL query at a time. You could apply sort and filter to your summarize and group queries, or you could join two tables and then summarize them. You can use the below query as an example of how you can easily combine two or more operations. Go crazy with data—with Draxlr, there is no stopping you!
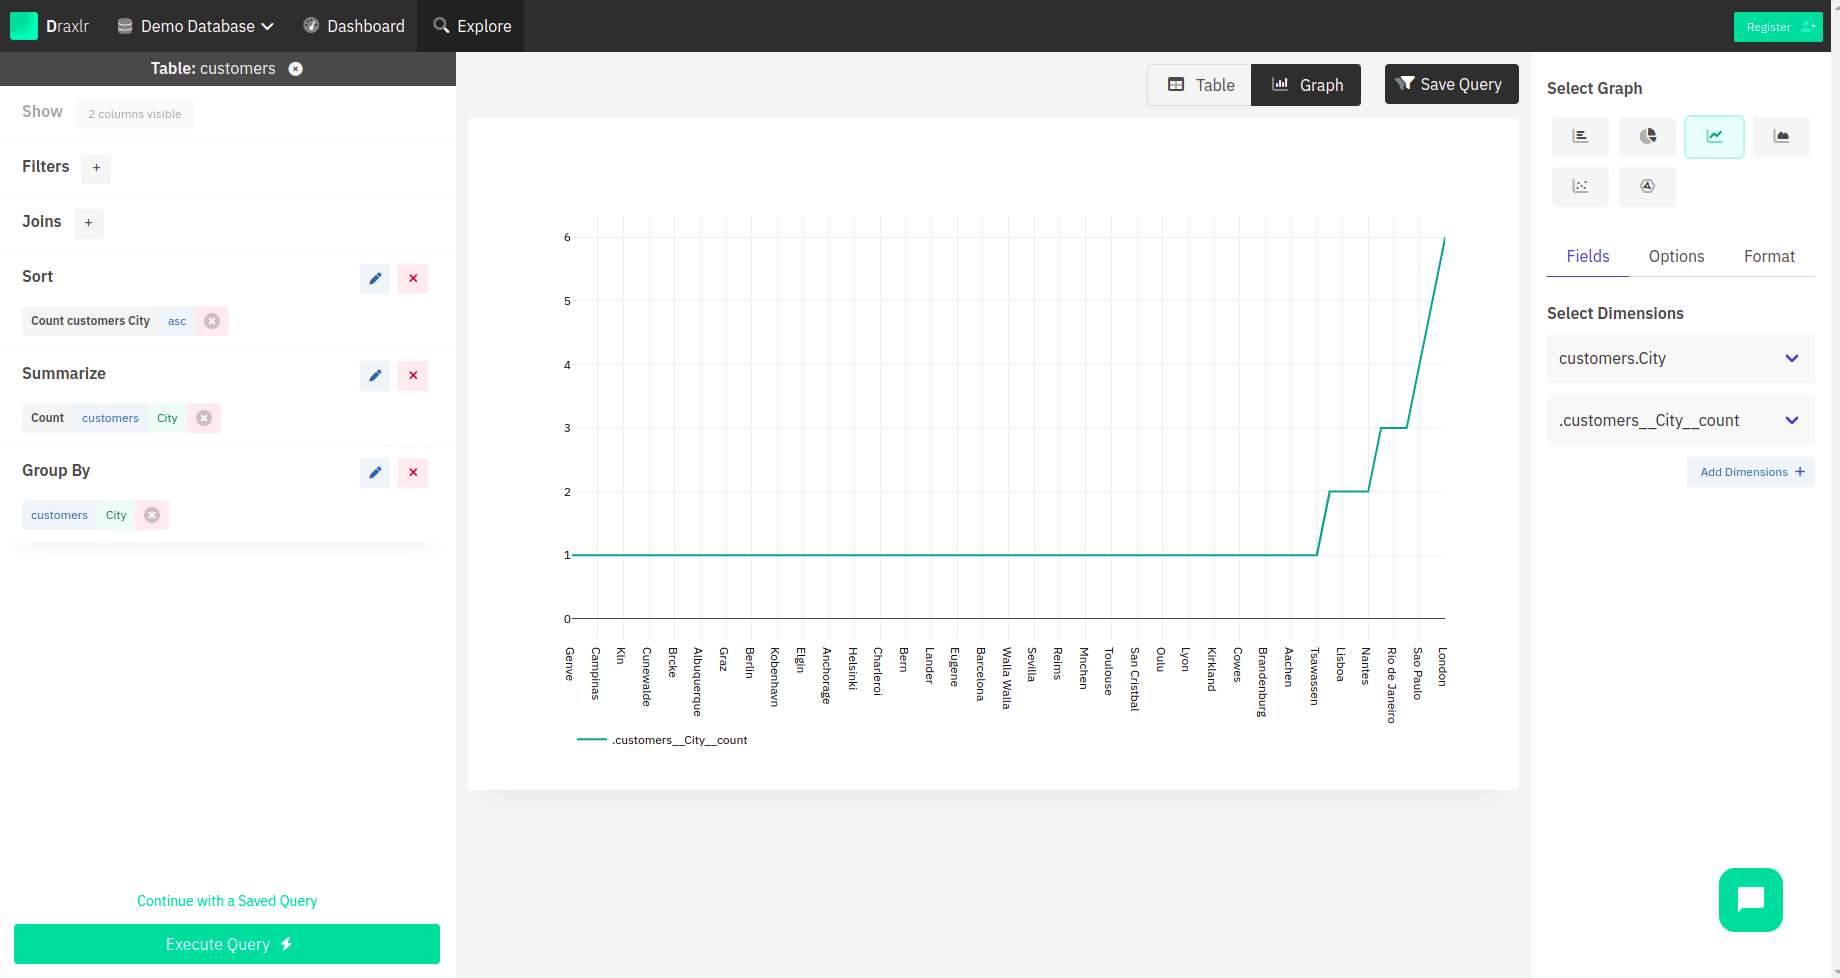
Not only that, in case you need to use the results in a client presentation or in a team catchup, you can also convert the tables into graphs. Multiple options for graphs are available, and you can choose according to your ease and comfort. Not only does this make the data look more presentable, but it also enhances the ease of understanding and analyzing it.
To add icing to the cake, you can export all your results to your local system anytime.
Moreover, if your team needs some metrics on a daily basis to track progress on a feature, you can create a SQL query, share it with your team, and also save it. This way, you would not have to go through the trouble of writing the same query each time. You can create a dashboard for you and your team with all the important queries that could be present in any of the graph formats that you use. In a nutshell, with Draxlr, you spend a lot less time managing data and a lot more time analyzing it, which is a very crucial step for any business to grow.
Complex SQL queries can get messy on their own, but with Draxlr, they become as simple as mixing and building blocks. If you’re still wondering how to go about executing the above, you can check out the free demo at Draxlr, which pretty much sums up all the operations they perform. Data is the future for any company looking for customer retention and acquisition because, as it is rightly said, figures don't lie. Check out Draxlr to get answers from your data while you focus on making those numbers skyrocket. Happy analyzing!

