PostgreSQL
Dashboard tool
Draxlr makes it easy to build a PostgreSQL data monitoring dashboard with interactive charts, real-time query insights and automated alerts.
What is PostgreSQL Dashboard?
A Postgres Dashboard for data analytics transforms PostgreSQL data into interactive visualizations, helping users explore trends, track metrics, and generate reports.
With real-time updates, embedded analytics, and custom alerts, it simplifies data-driven decision-making for both technical and non-technical users.
Many teams choose Postgres dashboard tools like Draxlr to simplify their data visualization and monitoring workflows.
Build SQL Dashboards in minutes
Connect with your SQL database
Sign up on Draxlr, choose a plan that suits your business, and connect Draxlr to your database. Connect multiple databases.
Filter, Sort, and Summarize data
Build queries to filter, sort, and summarize your data. Join data from multiple tables and group summarized values.
Build and share your Dashboards
Monitor data on multiple dashboards. Get data alerts, URL sharing, data image downloading, link embedding, and API.
AI Dashboard Generation
Automatically generate insightful PostgreSQL dashboards using AI. Simply connect your database, and let AI create relevant charts, graphs, and reports, saving time and effort.

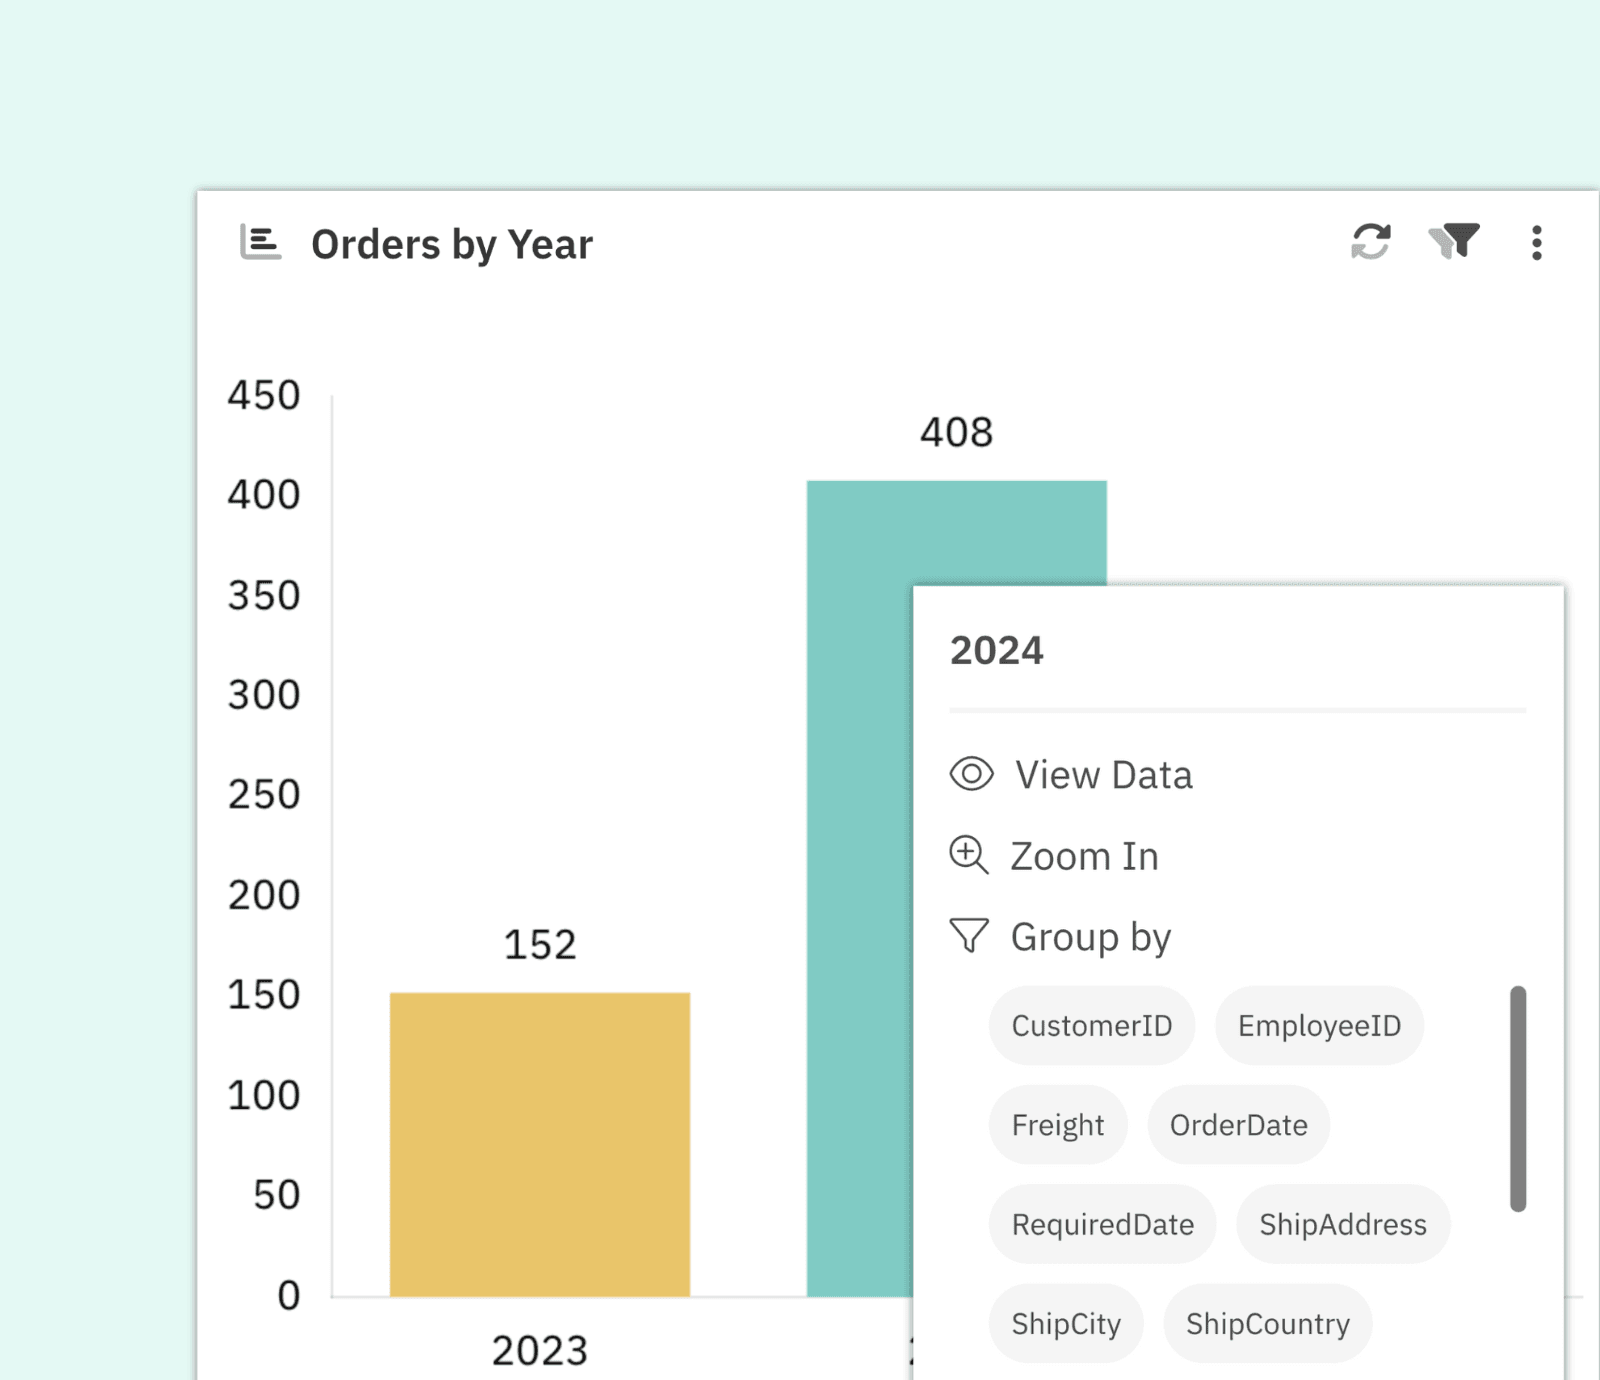
In-Depth Graph Exploration
Drill down into PostgreSQL graphs to analyze specific segments in greater detail. View underlying data, group segments by attributes, and zoom into date/time graphs for a more granular look at trends.
Seamless Dashboard Embedding
Effortlessly embed individual graphs or full PostgreSQL dashboards into your applications or websites with advanced controls. Pass customer context to personalize the experience, ensuring users see only their relevant data.

Diverse Chart Options
Visualize your PostgreSQL data with a wide range of chart types, including Bar, Line, Area, Pie, Sankey, Scatter, and Map. Customize each chart to fit your dataset and uncover meaningful insights with clarity.
Other Top Features
Flexible Dashboard Filters
Filter PostgreSQL data effortlessly using Text, Number, Date, and Boolean options. Apply dynamic filters to refine results and gain precise insights.
Self-Host
Host your PostgreSQL dashboards on your own infrastructure for better security and control. We also offer custom feature development based on your requirements.
Automated Email Reports
Receive daily or weekly PostgreSQL dashboard summaries straight to your inbox. Stay updated without needing to log in.
Live Data Updates
Ensure your PostgreSQL dashboards always display the latest insights with real-time data refresh—no manual updates required.
Who uses Draxlr
Customer Reviews
4.9
out of
5
Powerful and Beautiful Dashboards with Excellent Value and Support
Draxlr offers a clean, modern interface and makes it incredibly easy to build dashboards — even for non-technical users.
- Ole, CEO
Best for Dashboards based on Postgres
Super simple, almost no time to learn the tool. Draxlr is moving fast and building a lot of new valuable features.
- Founder in Facilities Services domain
Draxlr makes my data more useful and more collaborative
I've been using Draxlr for a year now and I LOVE it.
- Varun, CEO
Super easy to use and implement KPI visualization
Draxlr has completely transformed the way I work with data.
- שלמה, OPs manager
A plug'n'play Dashboard for Supabase
The query builder is honestly very intuitive and the graph elements very straightforward to understand.
- Niklas, CTO
A very useful tool
Very very good. The dashboards help us to understand in real time our customer behavior
- Paolo, CTO
Ready to build Dashboards
and set Alerts?
This website uses cookies to ensure you get the best experience.