Dashboard for
Supabase
Use Draxlr to build Supabase dashboard that turns tables into decision-ready insights. Draxlr's Supabase dashboard offers multiple chart types, real time data tracking, quick access to insights, interactive filters, and more.
What is Supabase Dashboard?
Supabase dashboard helps eliminate the gap between data and action. By providing a live, interactive view of your database, they enable faster insights, smarter tracking, and better collaboration.
You can explore tables, build Supabase dashboard reports, track data change alerts, embed dashboard, and use interactive charts to monitor what matters. Ideal for fast-growing teams, a dashboard for supabase eliminates manual workflows and supports faster data-driven decisions without dev help. This is made possible with the help of powerful Supabase dashboard tools.
Build SQL Dashboards in minutes
Connect with your SQL database
Sign up on Draxlr, choose a plan that suits your business, and connect Draxlr to your database. Connect multiple databases.
Filter, Sort, and Summarize data
Build queries to filter, sort, and summarize your data. Join data from multiple tables and group summarized values.
Build and share your Dashboards
Monitor data on multiple dashboards. Get data alerts, URL sharing, data image downloading, link embedding, and API.
AI Dashboard Generation

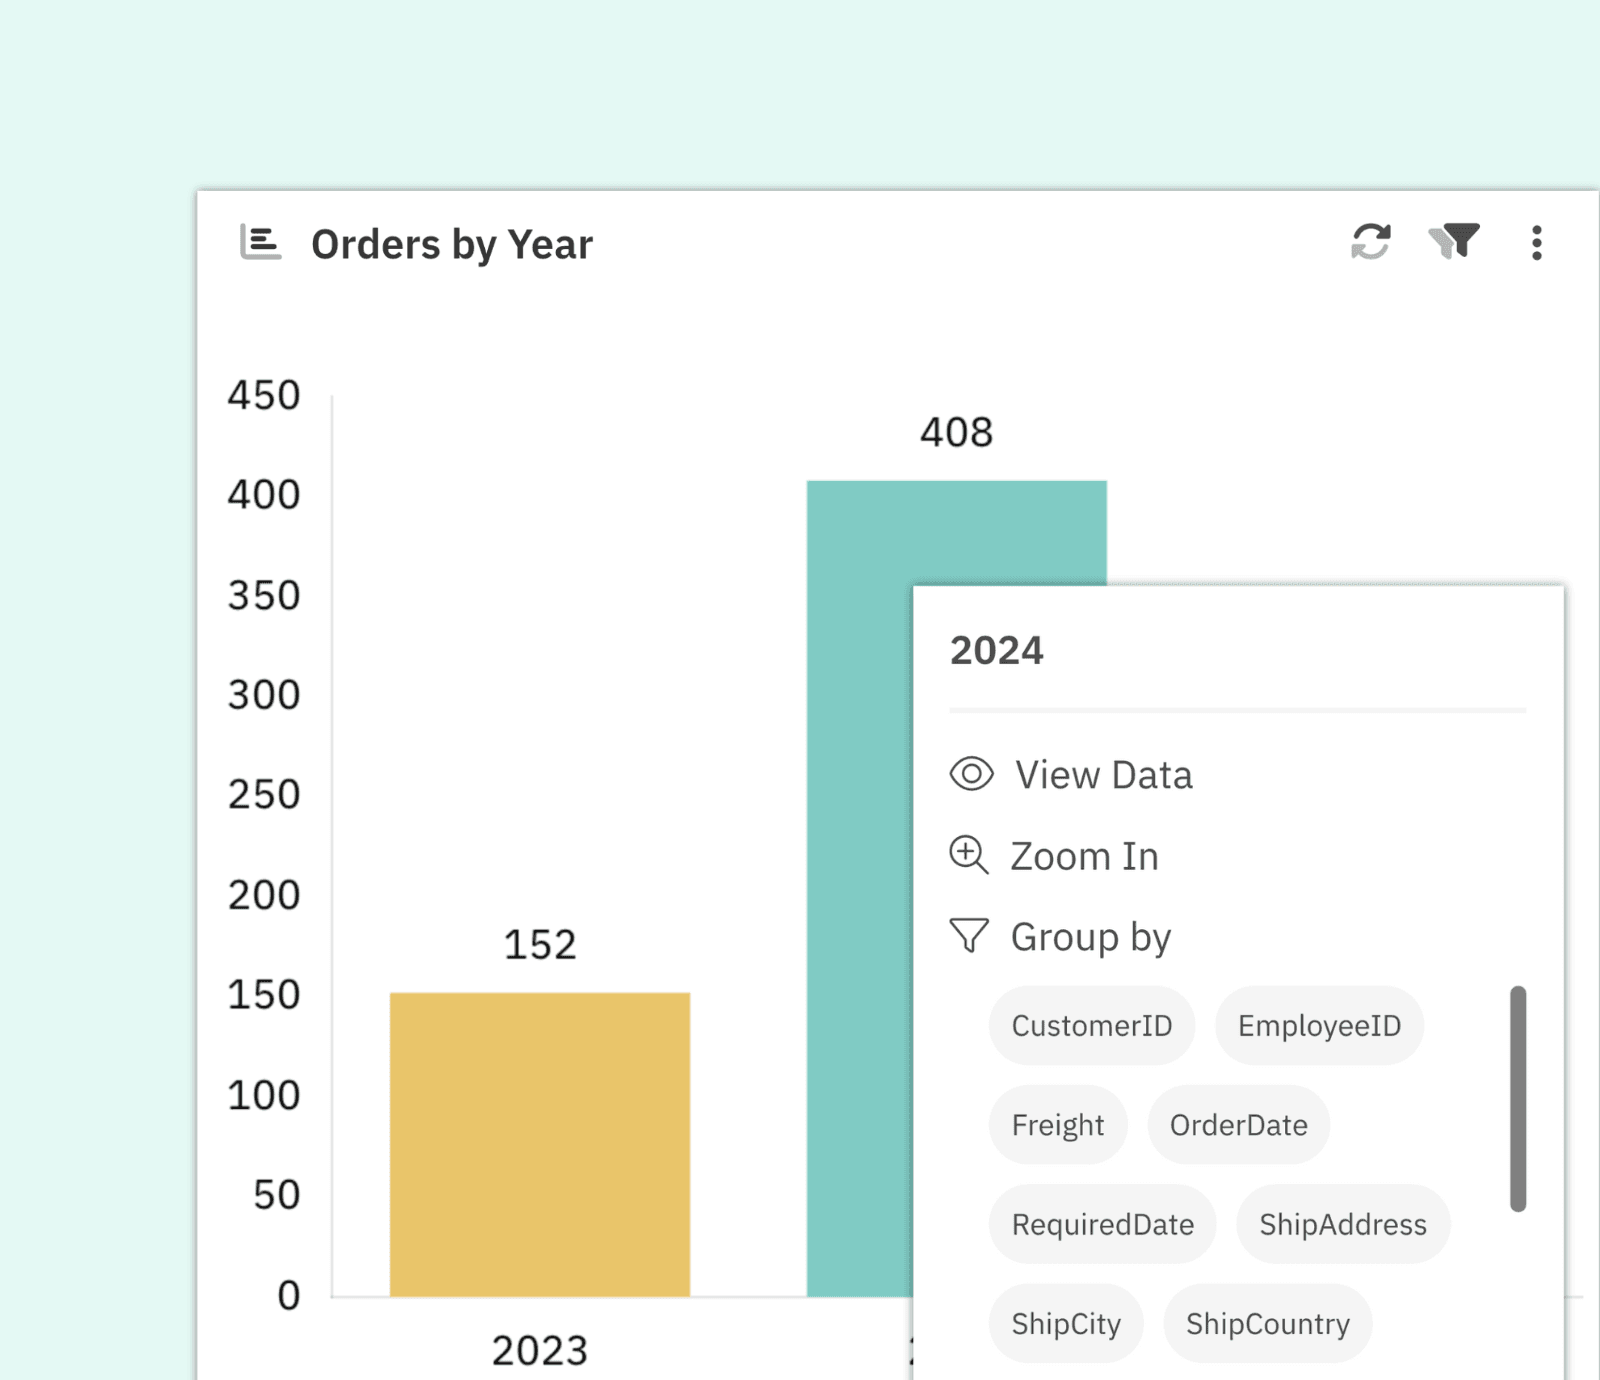
In-Depth Graph Exploration
Seamless Dashboard Embedding

Diverse Chart Options
Other Top Features
Flexible Dashboard Filters
Add dynamic filters to any dashboard for Supabase with support for text, number, date, and boolean. Use manual inputs or pull filter values directly from saved queries.
Self-Host
Deploy Supabase dashboard on your own infrastructure for full control and Security. We offer custom feature development to ensure the setup fits your workflow perfectly.
Automated Email Reports
Receive alerts for Supabase data changes through Slack or Email. Set checks as frequent as 3 minutes to catch updates the moment they happen.
Live Data Updates
Supabase dashboard update live as data changes. From metrics to detailed tables, every view reflects the latest information without needing to reload manually.
Who uses Draxlr
Customer Reviews
4.9
out of
5
Powerful and Beautiful Dashboards with Excellent Value and Support
Draxlr offers a clean, modern interface and makes it incredibly easy to build dashboards — even for non-technical users.
- Ole, CEO
Best for Dashboards based on Postgres
Super simple, almost no time to learn the tool. Draxlr is moving fast and building a lot of new valuable features.
- Founder in Facilities Services domain
Draxlr makes my data more useful and more collaborative
I've been using Draxlr for a year now and I LOVE it.
- Varun, CEO
Super easy to use and implement KPI visualization
Draxlr has completely transformed the way I work with data.
- שלמה, OPs manager
A plug'n'play Dashboard for Supabase
The query builder is honestly very intuitive and the graph elements very straightforward to understand.
- Niklas, CTO
A very useful tool
Very very good. The dashboards help us to understand in real time our customer behavior
- Paolo, CTO
Good product, will definitely recommend it!
Easy to use and configure. Straightforward user interface and good user experience.
- Timothy, Owner
Makes It Easy to Write Complex Queries
Draxlr's main purpose seems to be for setting up dashboards for visually analyzing data in a database, and it's great at that. However, I've been using it as a SQL building tool and it's been fantastic.
- Michael, Senior Project Manager
Building SQL queries in an easier way
Easy to use! It helps in the process of writing complex queries faster and to analyze data in dashboards. I liked the interface that provides a good user experience.
- Renato, CEO
Ready to build Dashboards
and set Alerts?
This website uses cookies to ensure you get the best experience.