Dashboard for
SQL Databases
Draxlr helps you build interactive dashboards for all your SQL databases - PostgreSQL, MySQL, MSSQL, PlanetScale, Yugabyte, and more. Query your data, visualize instantly, and share insights with your team.
What is a SQL Dashboard?
A SQL dashboard is a visual reporting tool that sits on top of your relational databases. Whether you're using PostgreSQL, MySQL, Microsoft SQL Server (MSSQL), or any SQL-compatible database, Draxlr helps you convert raw tables into meaningful visualizations.
SQL dashboards enable you to track KPIs, identify trends, and make faster, data-driven decisions. With Draxlr, this process is code-optional, fast, and built for collaboration.
Build SQL Dashboards in minutes
Connect with your SQL database
Sign up on Draxlr, choose a plan that suits your business, and connect Draxlr to your database. Connect multiple databases.
Filter, Sort, and Summarize data
Build queries to filter, sort, and summarize your data. Join data from multiple tables and group summarized values.
Build and share your Dashboards
Monitor data on multiple dashboards. Get data alerts, URL sharing, data image downloading, link embedding, and API.
Auto-Generate Dashboards with AI
Let Draxlr's AI create dashboards for your SQL schema. It analyzes your tables and relationships to generate useful charts and summaries instantly—saving you hours of manual setup.

Drill Into Your Data
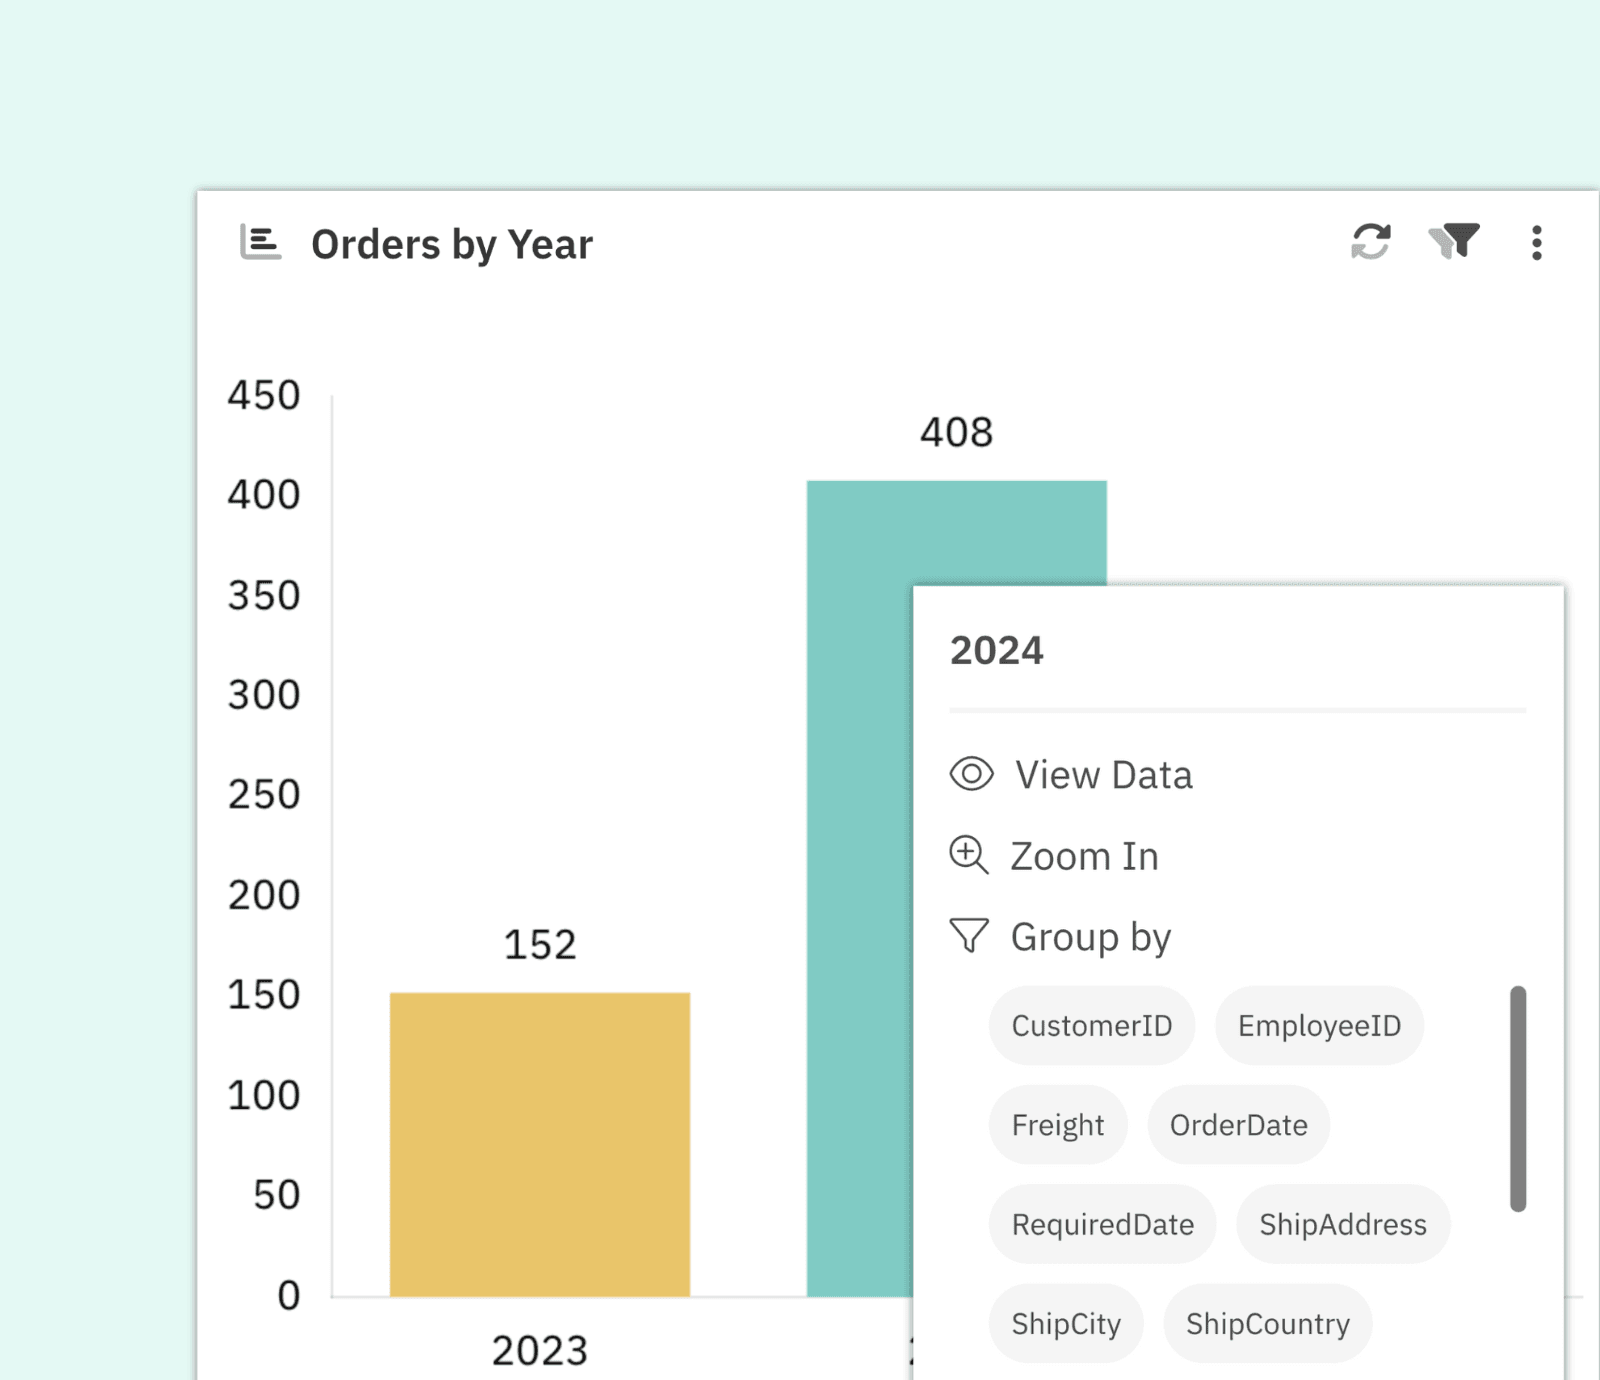
Interact with graphs to reveal underlying data. Drill down by time, group by attributes, zoom into date ranges, and view raw results—all directly from your SQL database.
Embed SQL Dashboards Anywhere
Embed charts or full dashboards into portals, internal tools, or client-facing apps. Use filters and parameters to personalize the data each viewer sees.

Supported Visualizations
Draxlr supports all the major chart types for SQL-based data including Bar, Line, Area, Pie, Sankey, Scatter, and Map. Customize each chart to fit your dataset and uncover meaningful insights with clarity.
Other Top Features
Filterable Dashboards
Enable filters like date ranges, dropdowns, booleans, and search fields—backed by your SQL database in real-time.
Self-Hosting Option
Deploy Draxlr on your own servers for increased control over security, compliance, and data access.
Scheduled Email Reports
Automate reporting by sending dashboards to stakeholders on a daily or weekly schedule.
Live Data Sync
Your dashboards always reflect real-time data, directly synced from your SQL databases.
Who uses Draxlr
Customer Reviews
4.9
out of
5
Powerful and Beautiful Dashboards with Excellent Value and Support
Draxlr offers a clean, modern interface and makes it incredibly easy to build dashboards — even for non-technical users.
- Ole, CEO
Best for Dashboards based on Postgres
Super simple, almost no time to learn the tool. Draxlr is moving fast and building a lot of new valuable features.
- Founder in Facilities Services domain
Draxlr makes my data more useful and more collaborative
I've been using Draxlr for a year now and I LOVE it.
- Varun, CEO
Super easy to use and implement KPI visualization
Draxlr has completely transformed the way I work with data.
- שלמה, OPs manager
A plug'n'play Dashboard for Supabase
The query builder is honestly very intuitive and the graph elements very straightforward to understand.
- Niklas, CTO
A very useful tool
Very very good. The dashboards help us to understand in real time our customer behavior
- Paolo, CTO
Ready to build Dashboards
and set Alerts?
This website uses cookies to ensure you get the best experience.